March 18 – 25
Total new: 51
- United States: 11
- Vietnam: 4
- United Arab Emirates: 1
- Poland: 12
- Belgium: 8
- United Kingdom: 2
- France: 1
- Netherlands: 5
- Portugal: 2
- Switzerland: 1
- Ukraine: 2
- Germany: 1
- Romania: 1
Total Capacity
Online nodes: 1822
Sleeping nodes: 699
Total nodes: 2521
|
|
Change |
| Cores |
65,346 |
2.21% |
| RAM |
494,681 GB |
4.77% |
| SSD |
9,768,465 GB |
3.26% |
| HDD |
23,140,849 GB |
-0.13% |
Utilization
Mainnet Utilization
|
|
|
| Cores |
5,822 / 64,650 |
(9.01%) |
| RAM |
4,598 / 440,167 GB |
(1.04%) |
| SSD |
84,203 / 9,696,150 GB |
(0.87%) |
| HDD |
1,164 / 22,904,803 GB |
(0.01%) |
Testnet Utilization
|
|
|
| Cores |
76 / 696 |
(10.92%) |
| RAM |
206 / 4,925 GB |
(4.18%) |
| SSD |
3,084 / 18,177 GB |
(16.97%) |
| HDD |
0 / 236,047 GB |
(0.0%) |
Total Utilization
|
|
|
| Cores |
5,898 / 65,346 |
(9.03%) |
| RAM |
4,804 / 445,092 GB |
(1.08%) |
| SSD |
87,287 / 9,714,327 GB |
(0.9%) |
| HDD |
1,164 / 23,140,849 GB |
(0.01%) |
Utilization Charts
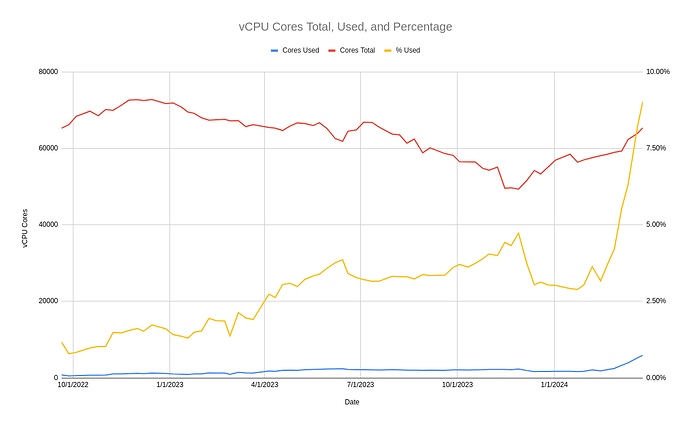
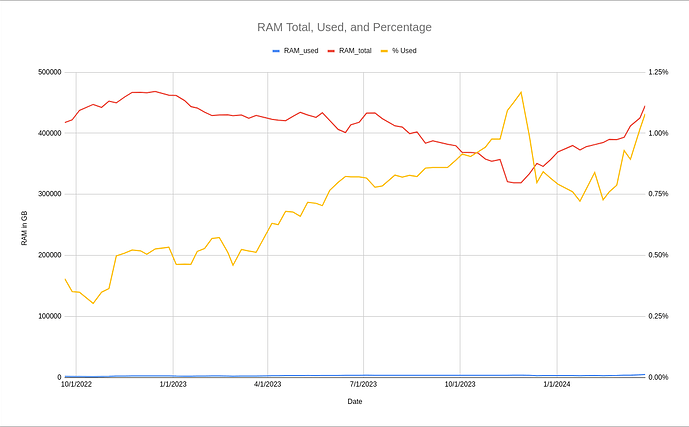
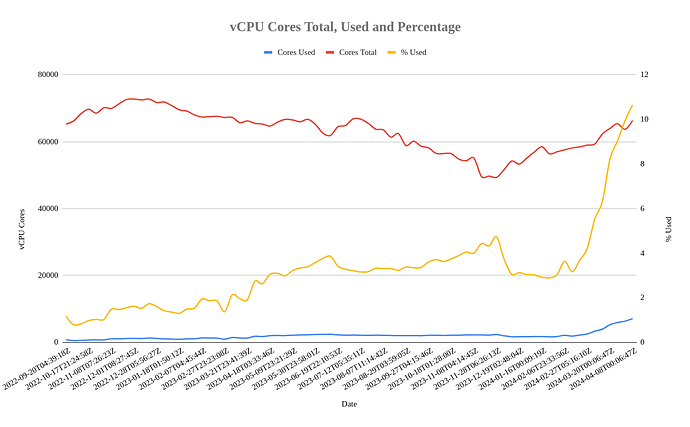
So this one’s been a long time coming. I finally collected all the data from posts in this series and did a bit of graphing. Below are two charts, showing the CPU and RAM total and utilized figures since September 2022.
Due to limitations in how the data from TF Chain is made accessible, it’s not straightforward to produce graphs of all available data. So for now we’re limited to my weekly data points for roughly the time span since I started this series. A future project would be to get a better resolution data set from the beginning of TF Chain.
For now, I hope you enjoy these nice graphs 


