In the upcoming 3.13 release, we have made significant enhancements to our platform. The dashboard has undergone a migration to Vue 3, and we have seamlessly integrated the playground into the dashboard with the aim of delivering a more accessible and consistent user experience for our ThreeFold users.
As well, the UI has undergone a series of noteworthy improvements, contributing to an overall enhanced user experience. User Interface refinements include:
- Adjustments to the positioning and color schemes of tooltips and warnings. These changes have been made to ensure a more intuitive and consistent experience.
- The wording of titles, tooltips, and warning messages has been revised to improve clarity.
- A focus has been placed on strengthening the validations applied to various fields within the UI.
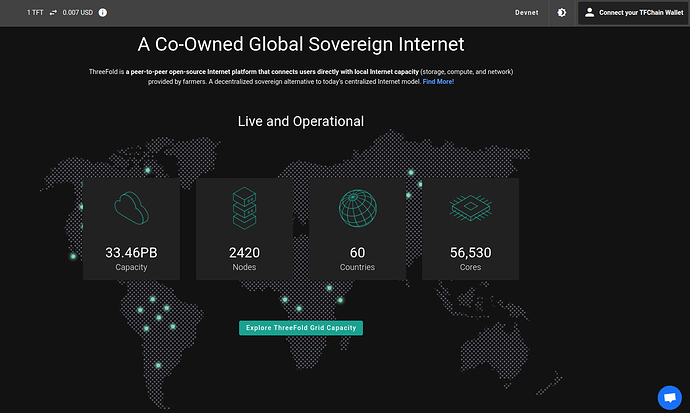
The Loading / Landing Page
The landing page remains familiar, but we’ve added the exchange rate for TFT, making it easier to track.
You will face a loading screen that informs you if your connection is slow.
When a user connects their TFChain wallet, their available and locked balances are displayed, along with a “GET TFT” button for easy wallet funding.
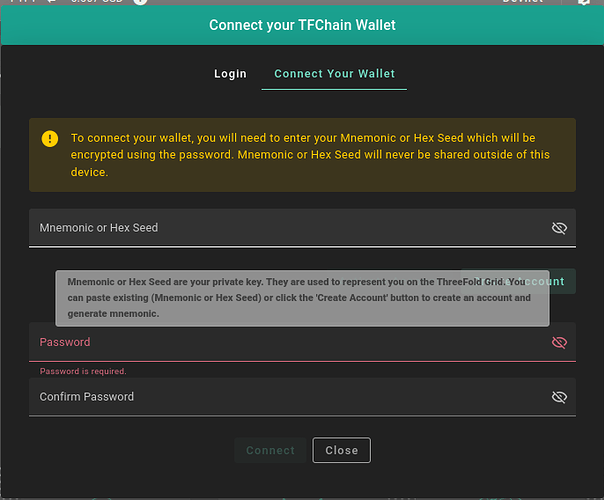
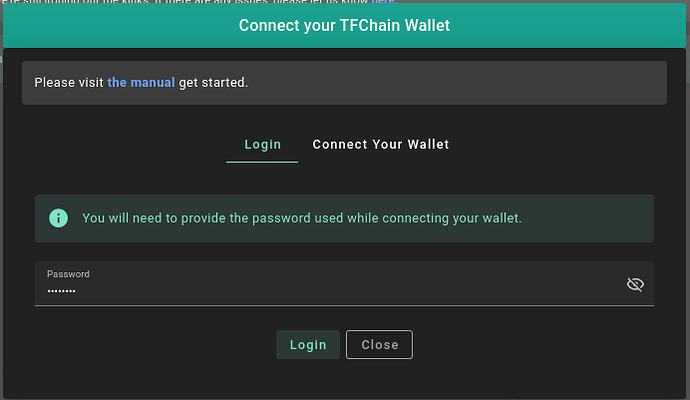
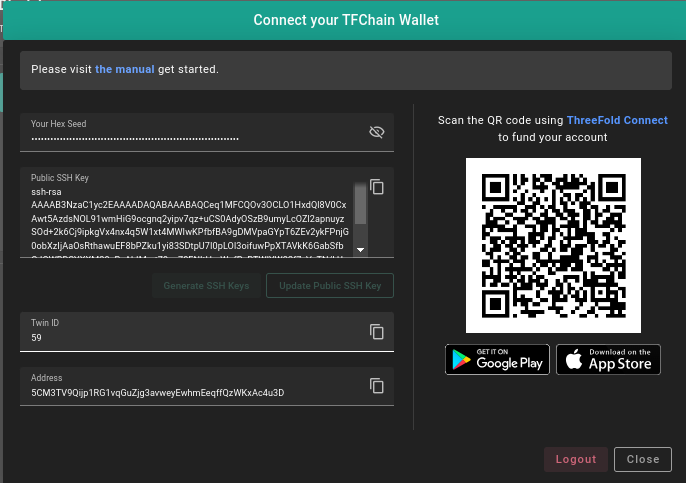
Signup / Login Screen
Notice that we also support hex seeds now as well.
After Login (User Profile)
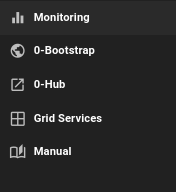
Access ThreeFold Services from the Sidebar
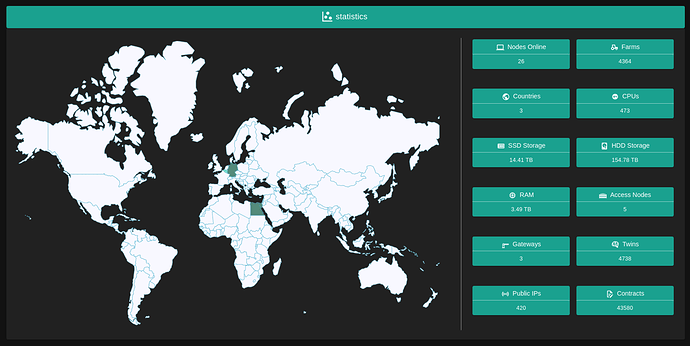
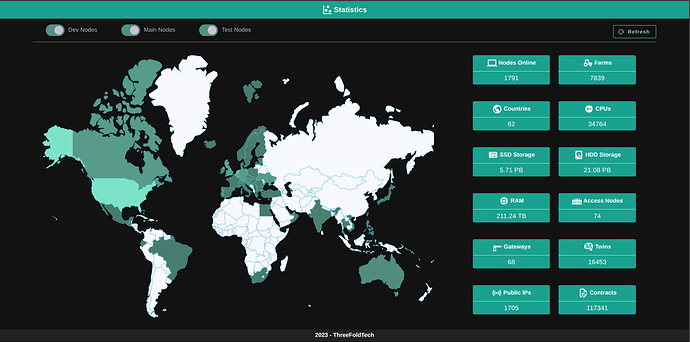
Grid Statistics
We did some updates on the statistics view, (that’s also reused in the statistics website).
Twin Page
Shows you information about your twin id, account address and the relay used to serve your communications with the grid.
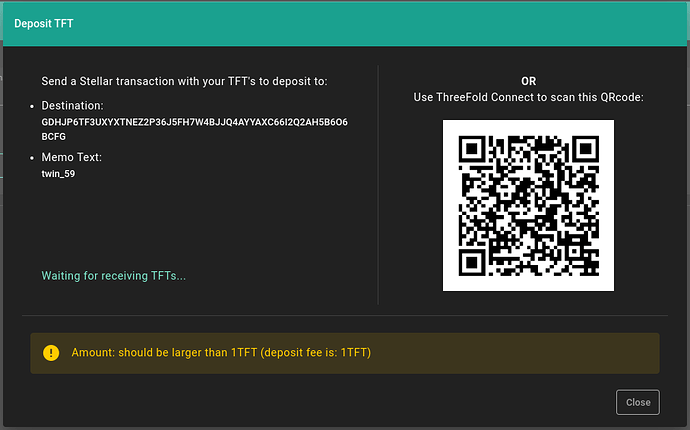
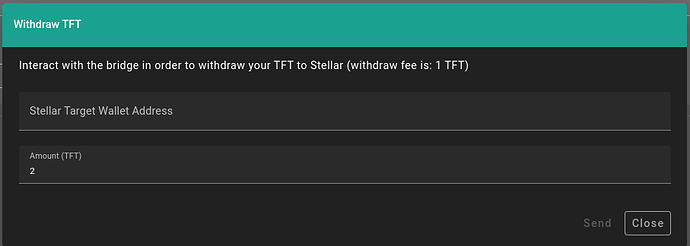
Bridge
Provides the means to deposit from Stellar or withdraw to Stellar. There are plans to integrate more – the decision to limit it to Stellar only isn’t final yet.
Transfer TFTs on TFChain
You can transfer now by the Twin ID.
Or transfer by address.
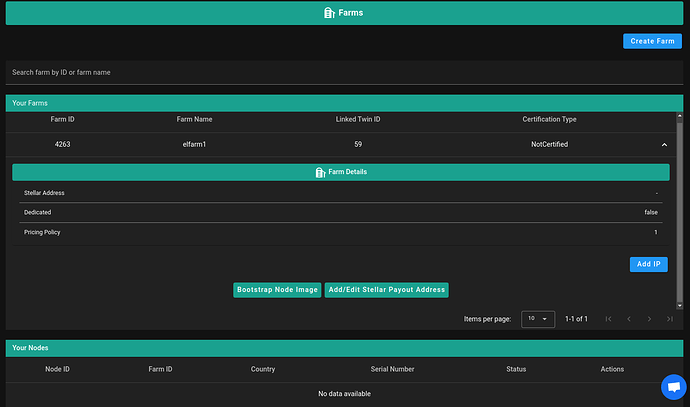
Farms View
You should have a similar experience of the Farm Management interface (it’s still under ongoing enhancements)
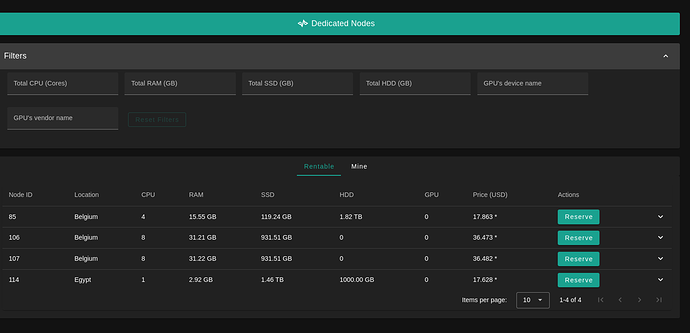
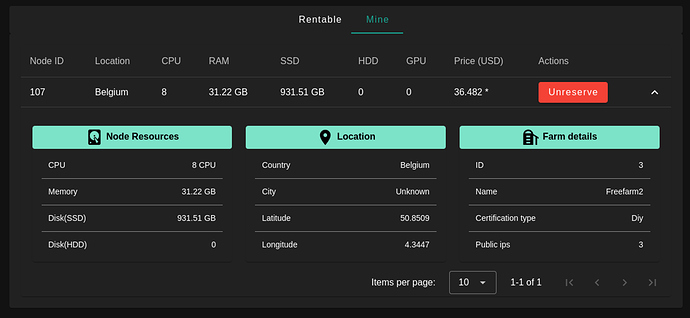
Dedicated Nodes
You can view, rent full nodes.
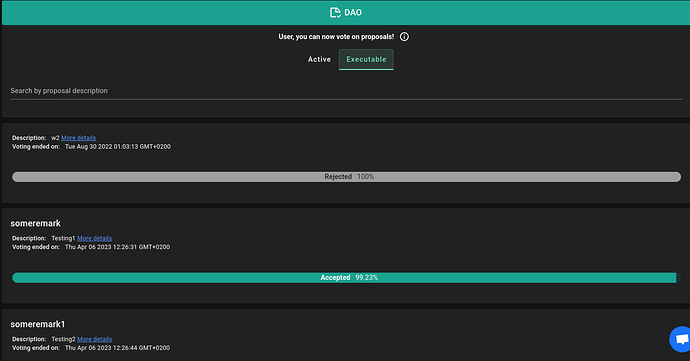
DAO Page
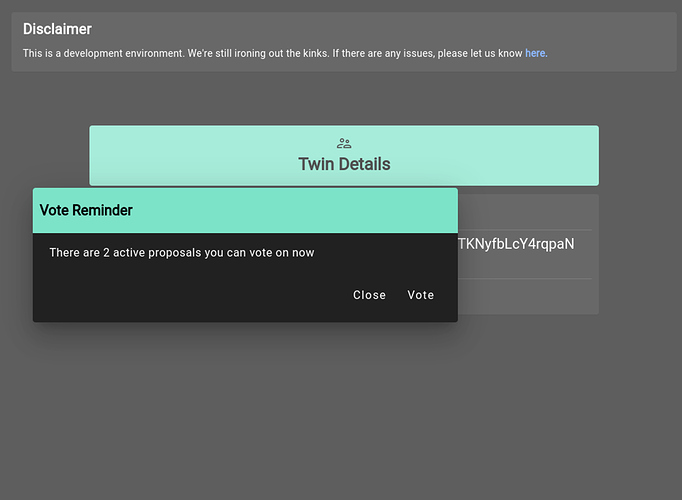
Users who own farms with at least one online node will be notified by a pop-up notification regarding active proposals.
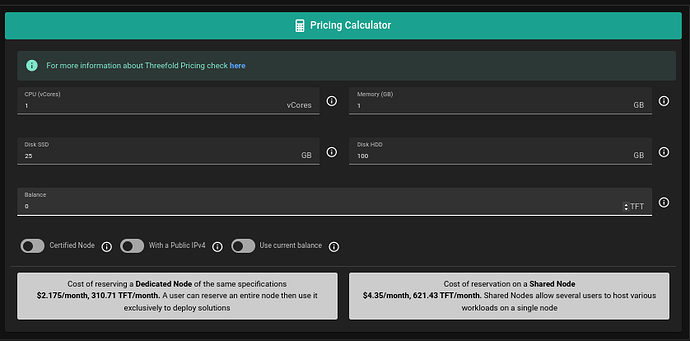
Pricing Calculator
It received bunch of updates, and more interactivity been provided

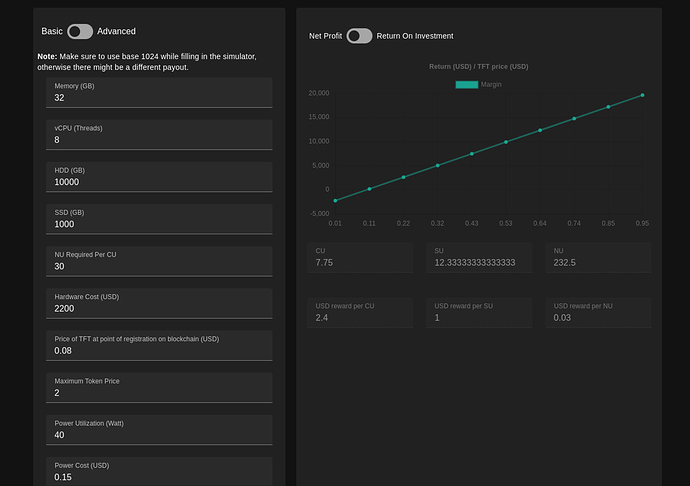
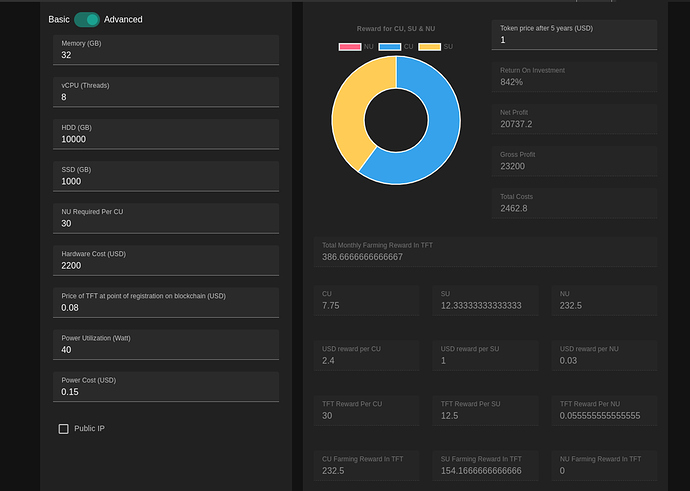
Simulator
We did a complete rewrite for the simulator.
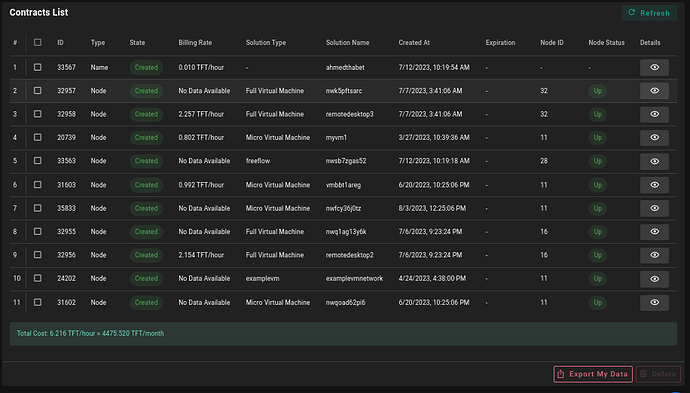
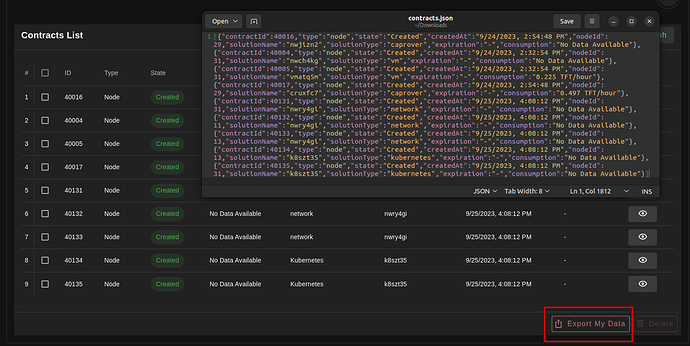
Contracts View
Our helpful contracts list view now features more information as the NodeID and the Node Status (in case your contract is deployed on an offline node), You will also receive notifications periodically based on that too.
You can also export your contracts information as json file using the Export
Also, a nice addition, providing the total cost of your contracts in TFT and USD
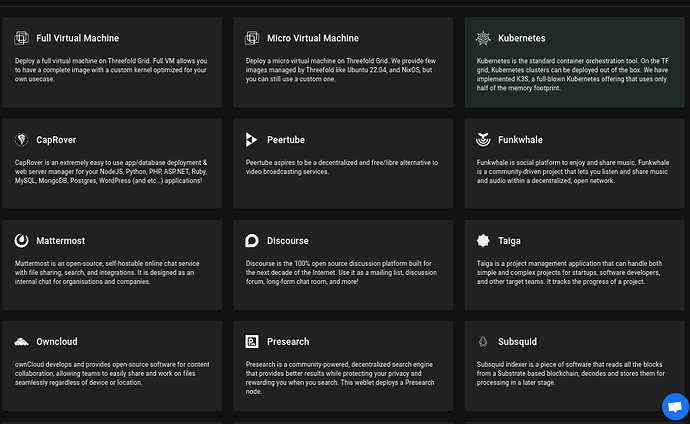
Solutions View
We moved to Cards view similar to what we had in Grid v2 Marketplace
Farms/Nodes Selection During Deployments
We acted based on community’s feedback on disabling the automatic validation and filtration happening based on the slightest user changes (it shows the interface as very slow when you have very large dataset e.g on mainnet)
We are bringing the option to choose NodeID back along with filters you fill and request to search at your own pace instead of the software doing that on every change
Defaults
There’re many changes applied on the defaults used for the solutions, but you can always update them to fit your own needs!
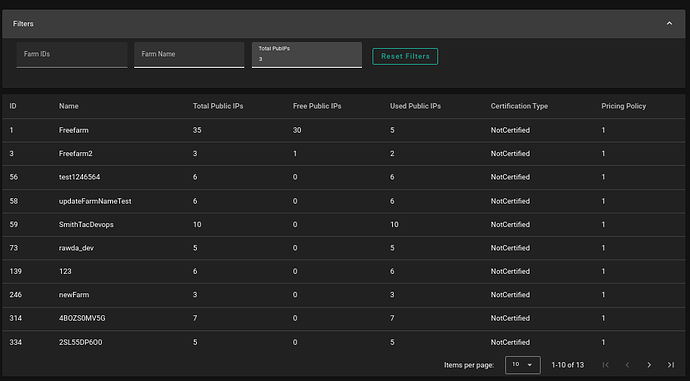
Farms View
It has gone through many updates aiming for simplicity and accessibility of the filters
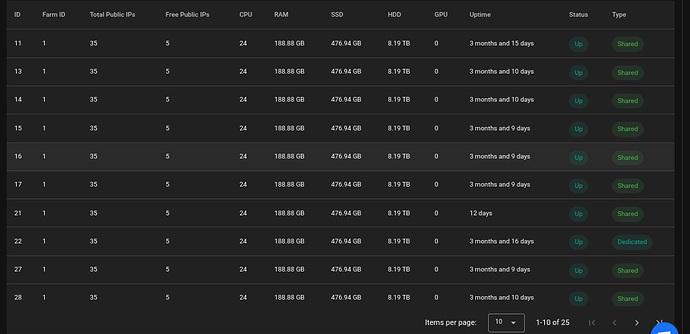
Nodes View
We tried to include as much as we could e.g if it was Shared or Dedicated, and number of GPUs in the node
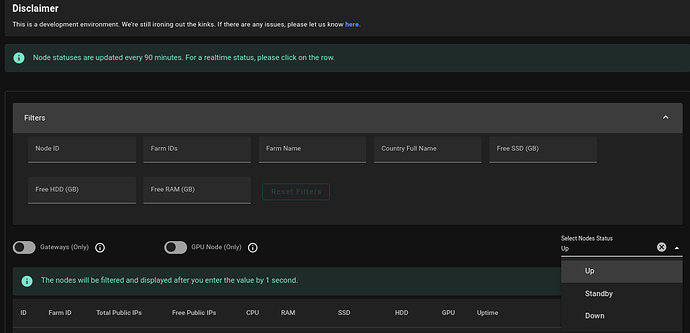
Filters
We believe the filters now are more accessible to the user with the most common required filters
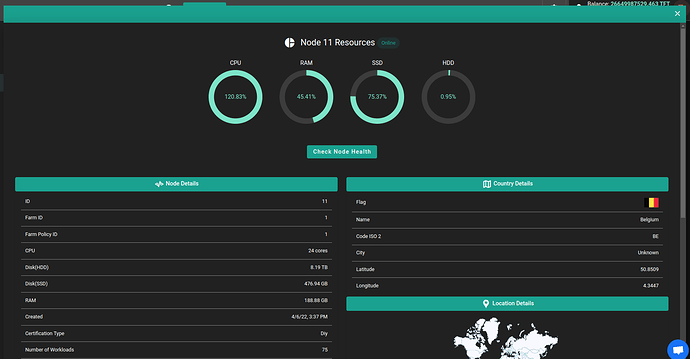
Node Details
This is how it looks in the new design:
Error reporting
Given that the system is distributed, in a very unusual way, there’re lots of scenarios we are still discovering and hardening, noticeable updates in there
- In case of failures while connecting to the RMB server, the error message will show which RMB failed to connect.
- When failing to load deployments we try to list and state the reason if possible
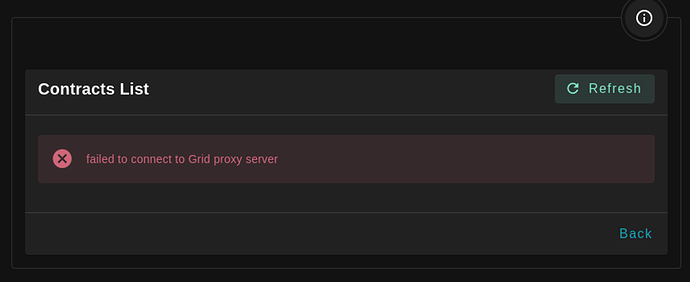
- When failing to connect to the gridproxy
We are trying to be as explicit regarding the errors and let the user know
Statistics Website
The statistics website has undergone a migration to Vue 3 with the aim of delivering a more accessible and consistent user experience for our Threefold users.
Timeouts on the System
We changed the timeouts from 60s to 20s and increased the amount of information shown to the user
Still to be Addressed
Dashboard Monitoring
Can see the issue here aiming to
- integrate more health checks/alerts in case of any broken service e.g gridproxy, rmb, tfchain, … etc to inform the user there’s a degradation happening in performance
- allowing the user to export their logs/debug information to be able to send in a bugreport
- with user consent we can push the errors that happens to our operations for insights on how the system is behaving.
Mycelium
We will start the process of integrating mycelium in ZOS and building its infrastructure, check our staging website for more information on mycelium www2.mycelium.threefold.io/
Docker/Docker-Composed based Stack
We are trying to also make things more easy for people to run the whole stack of threefold grid on their own easily (but we are still progressing on that)
Yggdrasil 0.5
We are moving forward with upgrading yggdrasil to 0.5, out tests seem to have worked fine, and there should be no reason not to upgrade
There’re so much coming in and a single post won’t do it justice, but feel free to check everything we been working on our 3.13 project view https://github.com/orgs/threefoldtech/projects/199/views/1
Also, please note all of the UI changes are still subject to updates based on the iterative feedback process 
Looking forward to hearing your feedback!

