
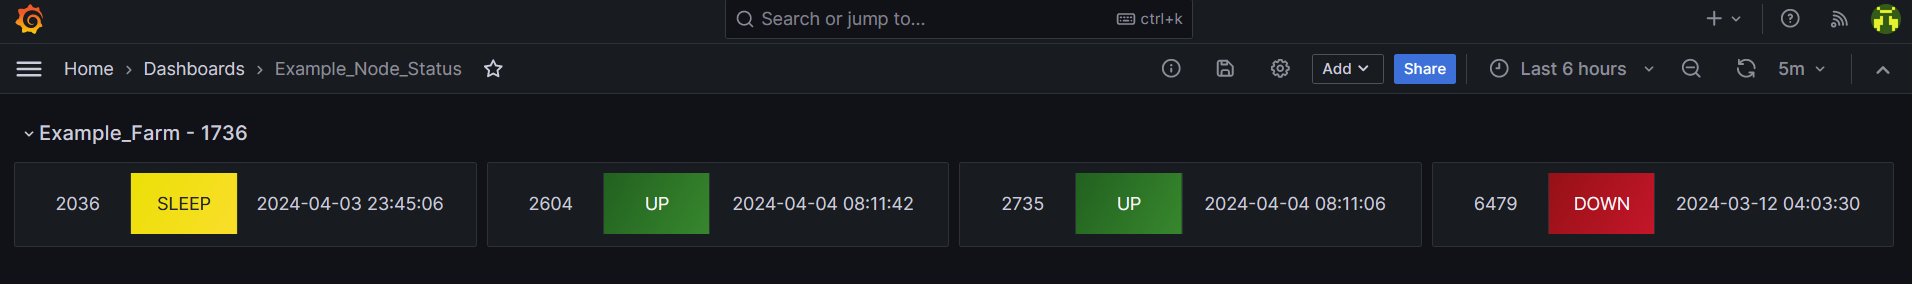
This guide will walk you through how to monitor your farm using Grafana. It took me a while to set this up but it’s extremely useful for an at-a-glance update on node status and I’m certain others will find it helpful. You’ll need to create a Grafana account if you don’t already have one - the free level is fine for our use case.
Once you have the account created it’s time to get to work. First thing we need to do is install a data source called “infinity” which allows easy handling of JSON data within Grafana.
- At home screen click Connections > Add new connection
- Click search box and type infinity, click infinity under Data source
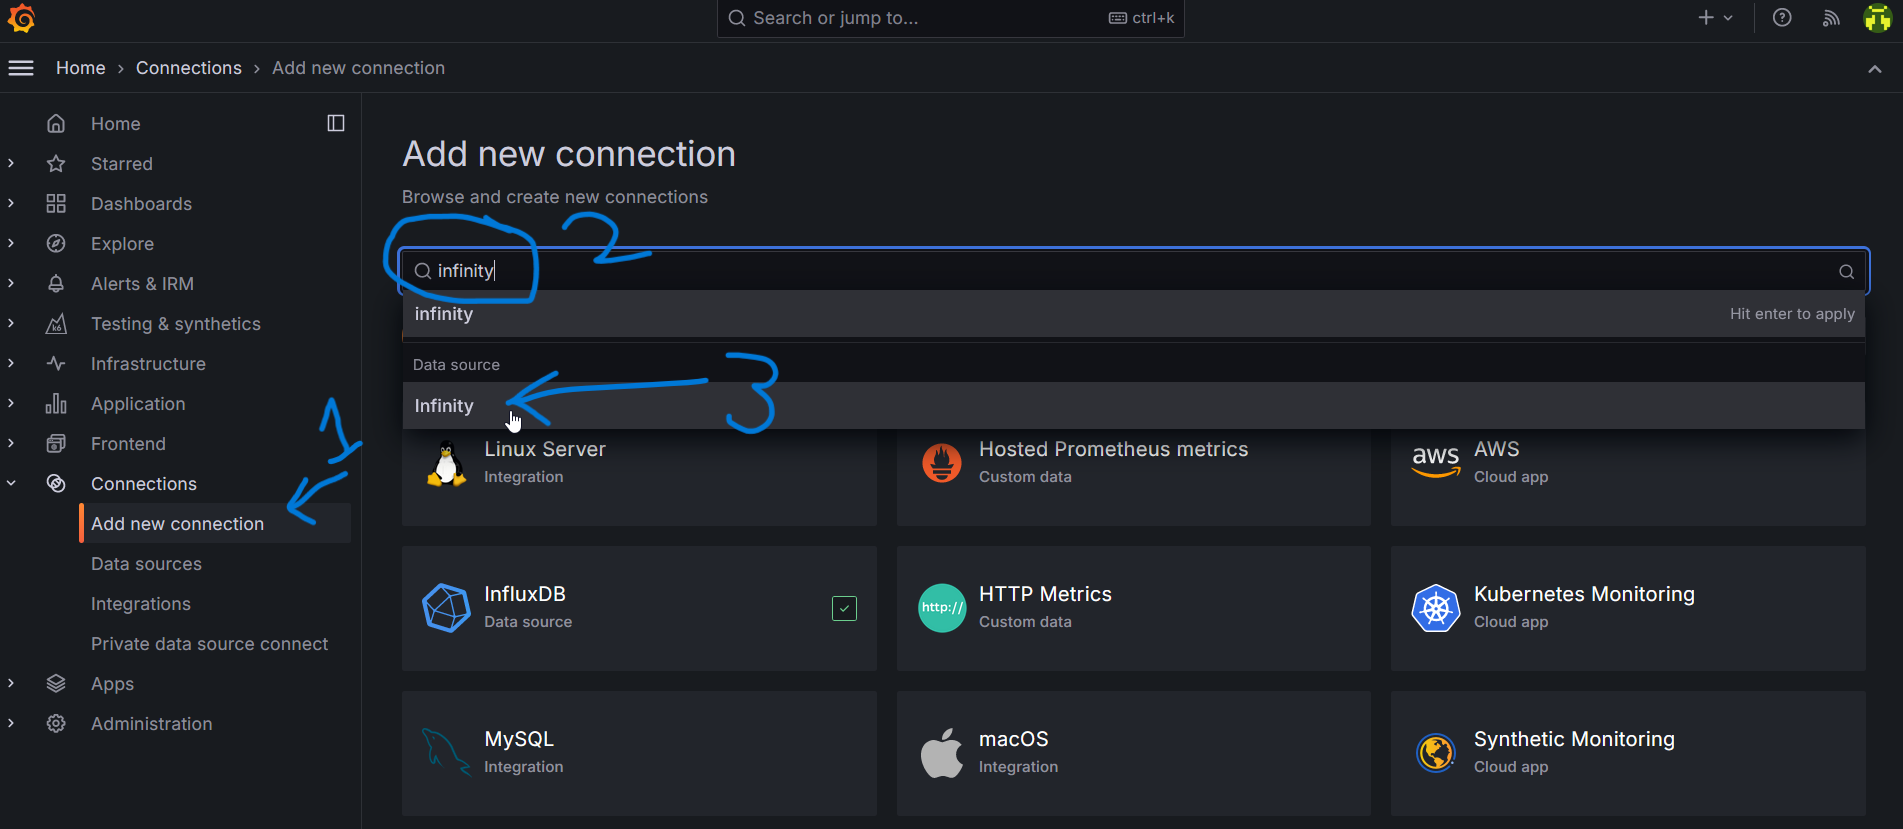
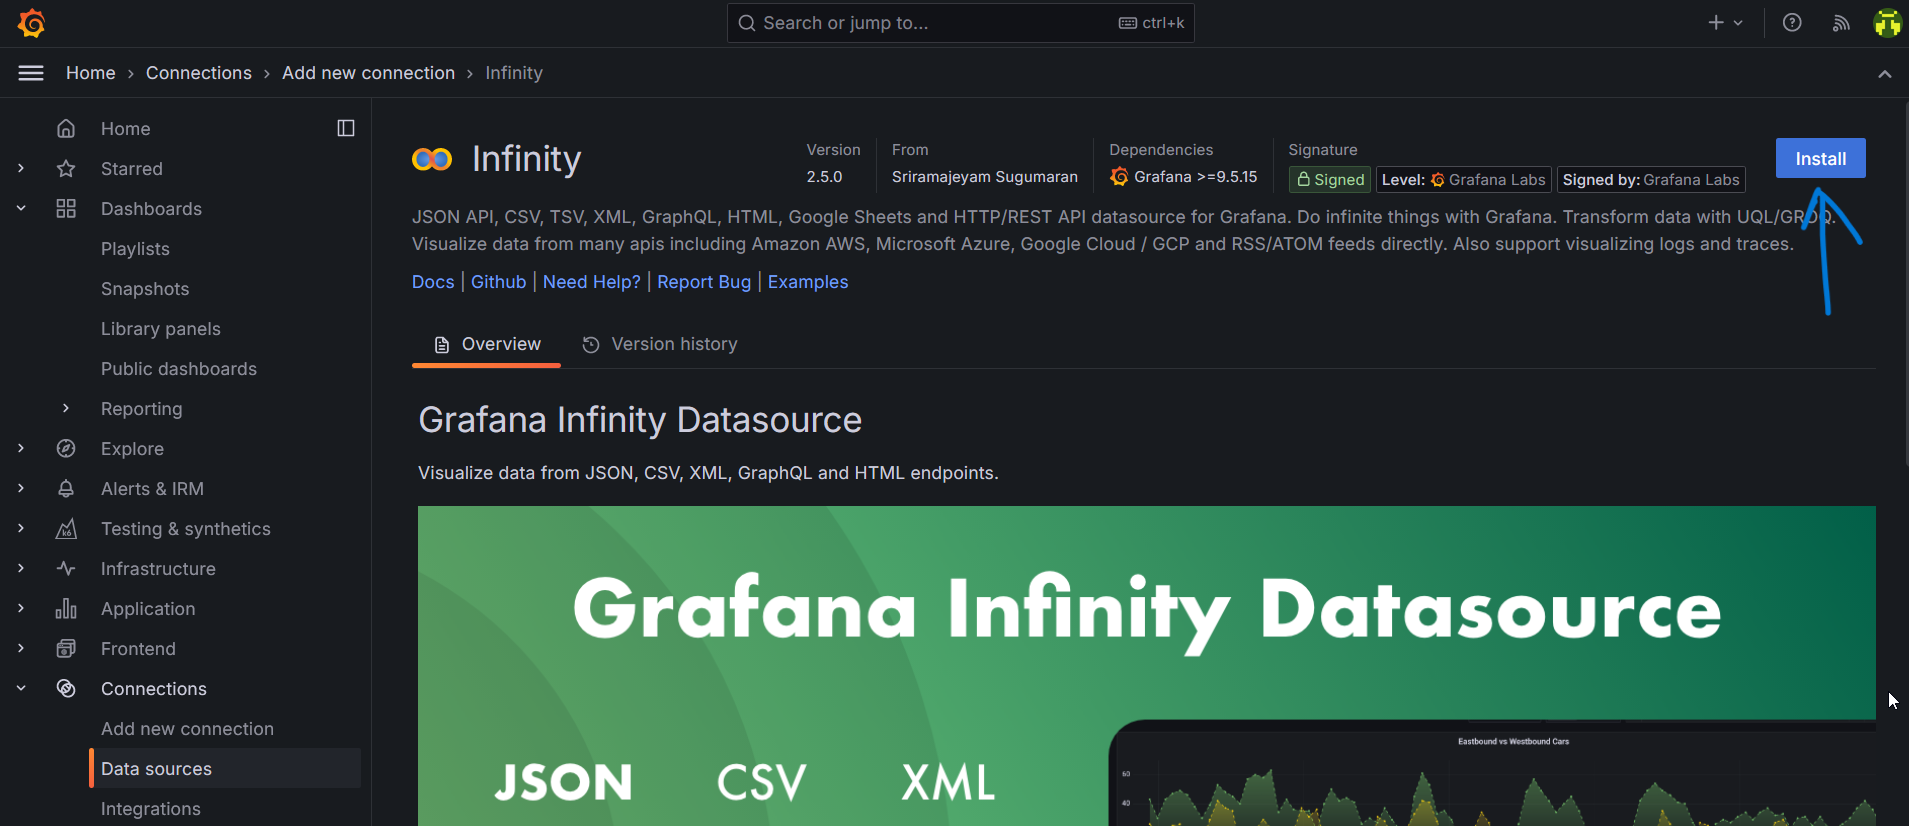
- Install Infinity
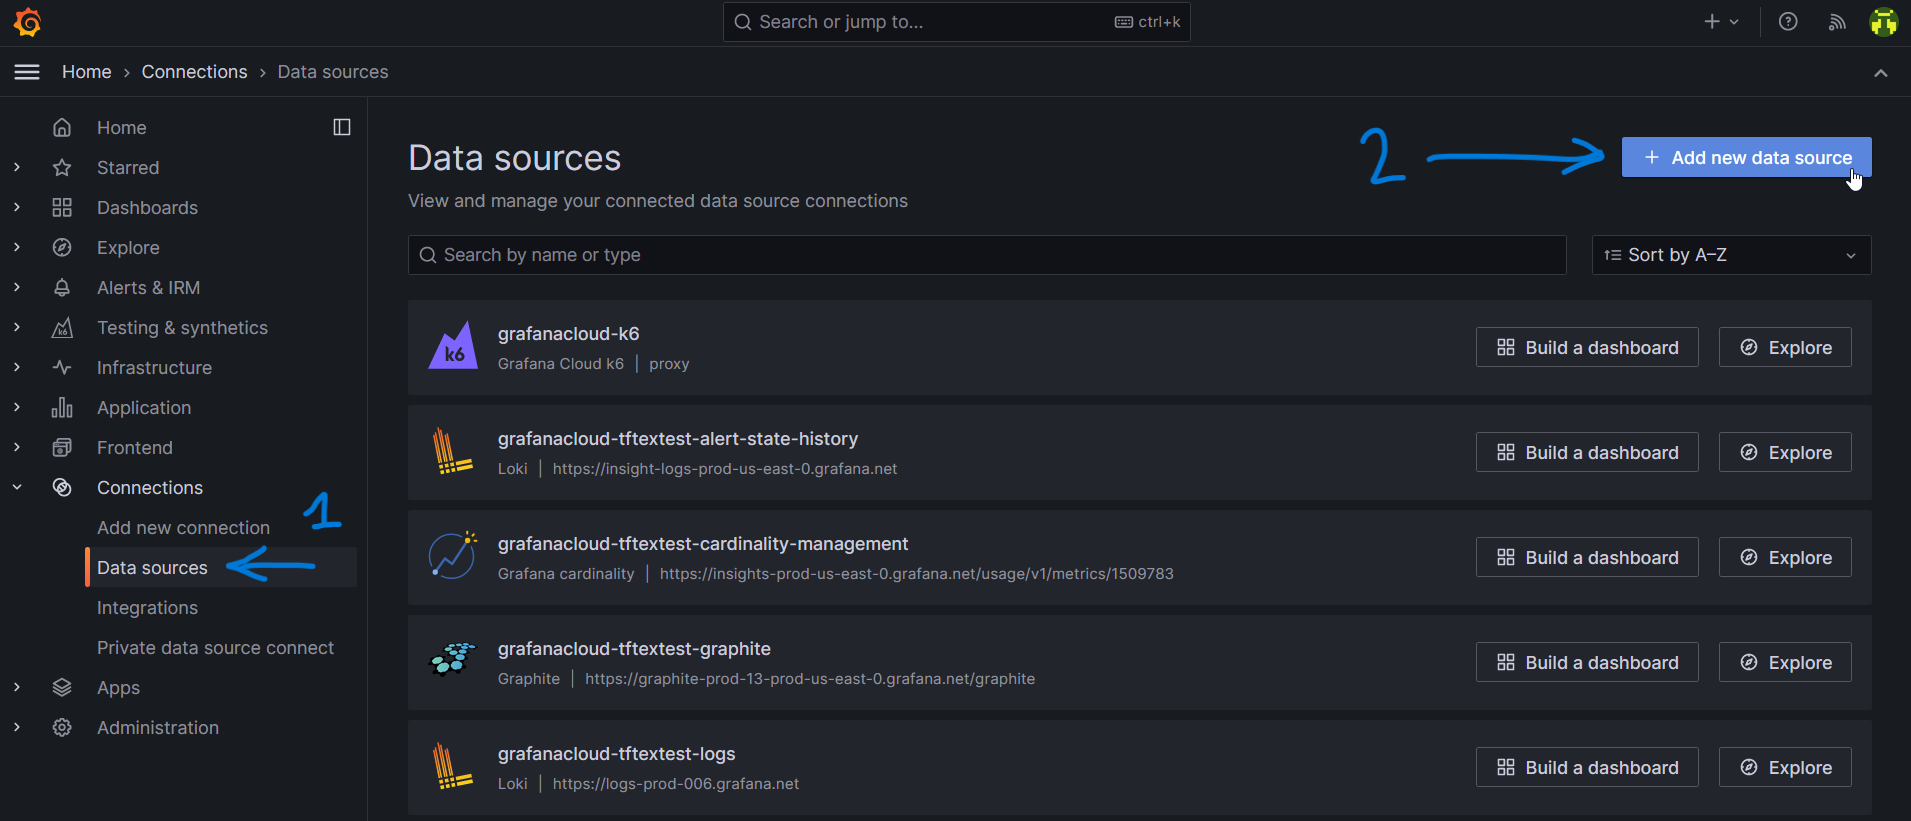
Next we need to add infinity as a data source
- At home screen click Connections > Data sources
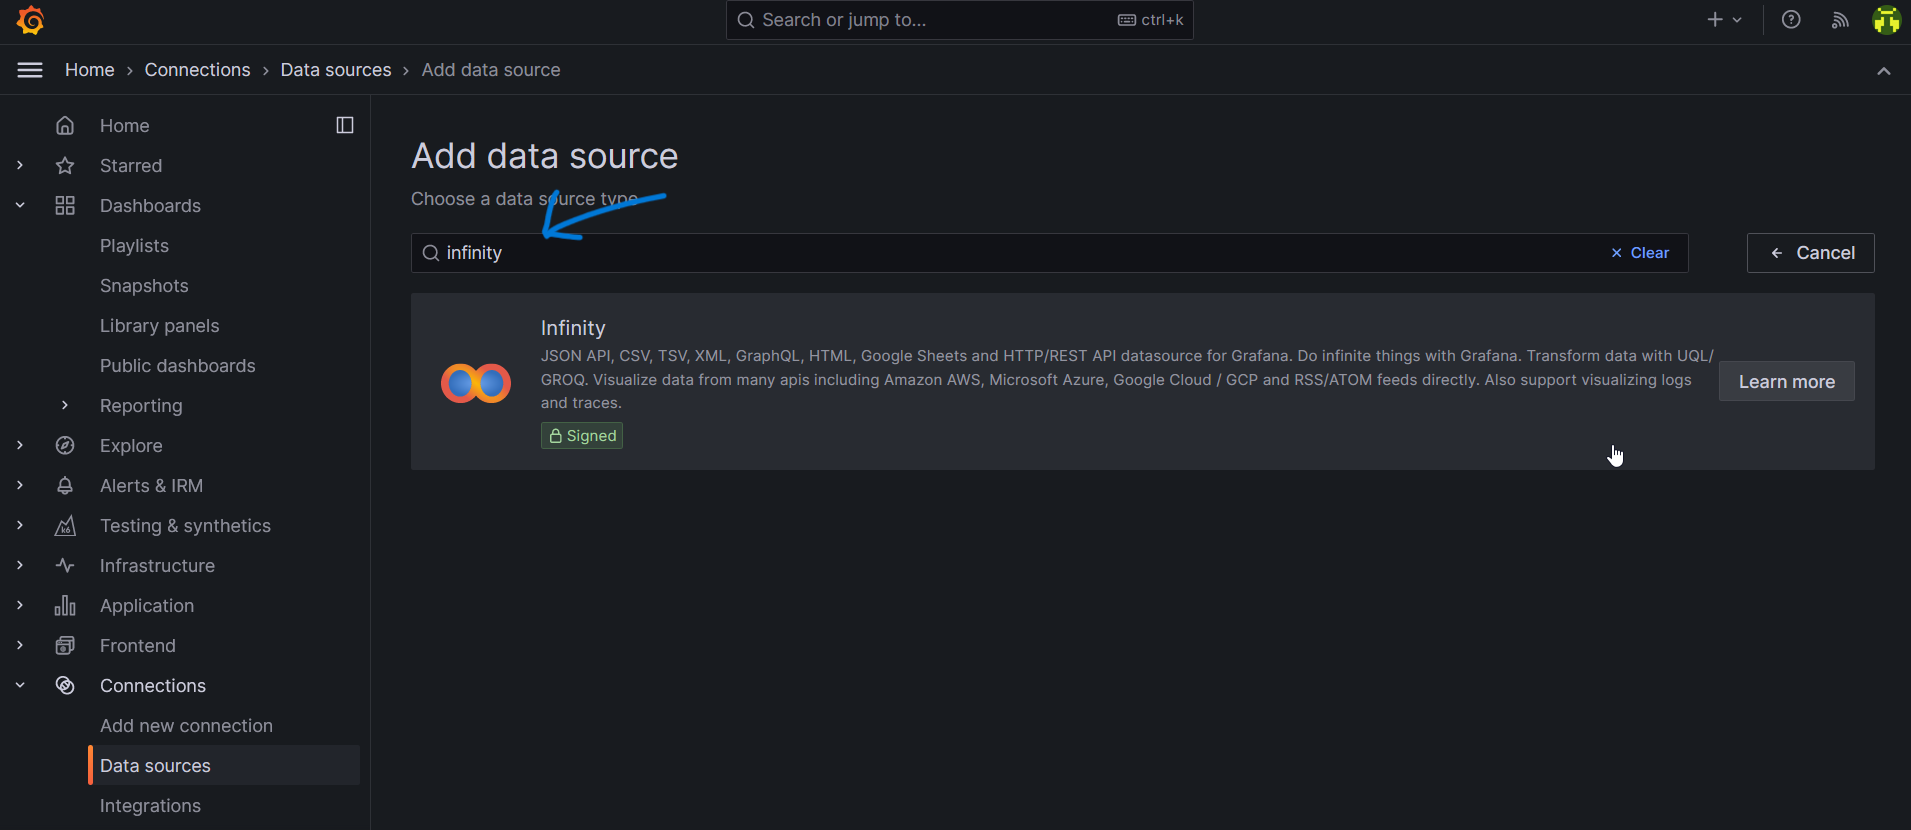
- Click Add new data source
- Search infinity, click the result
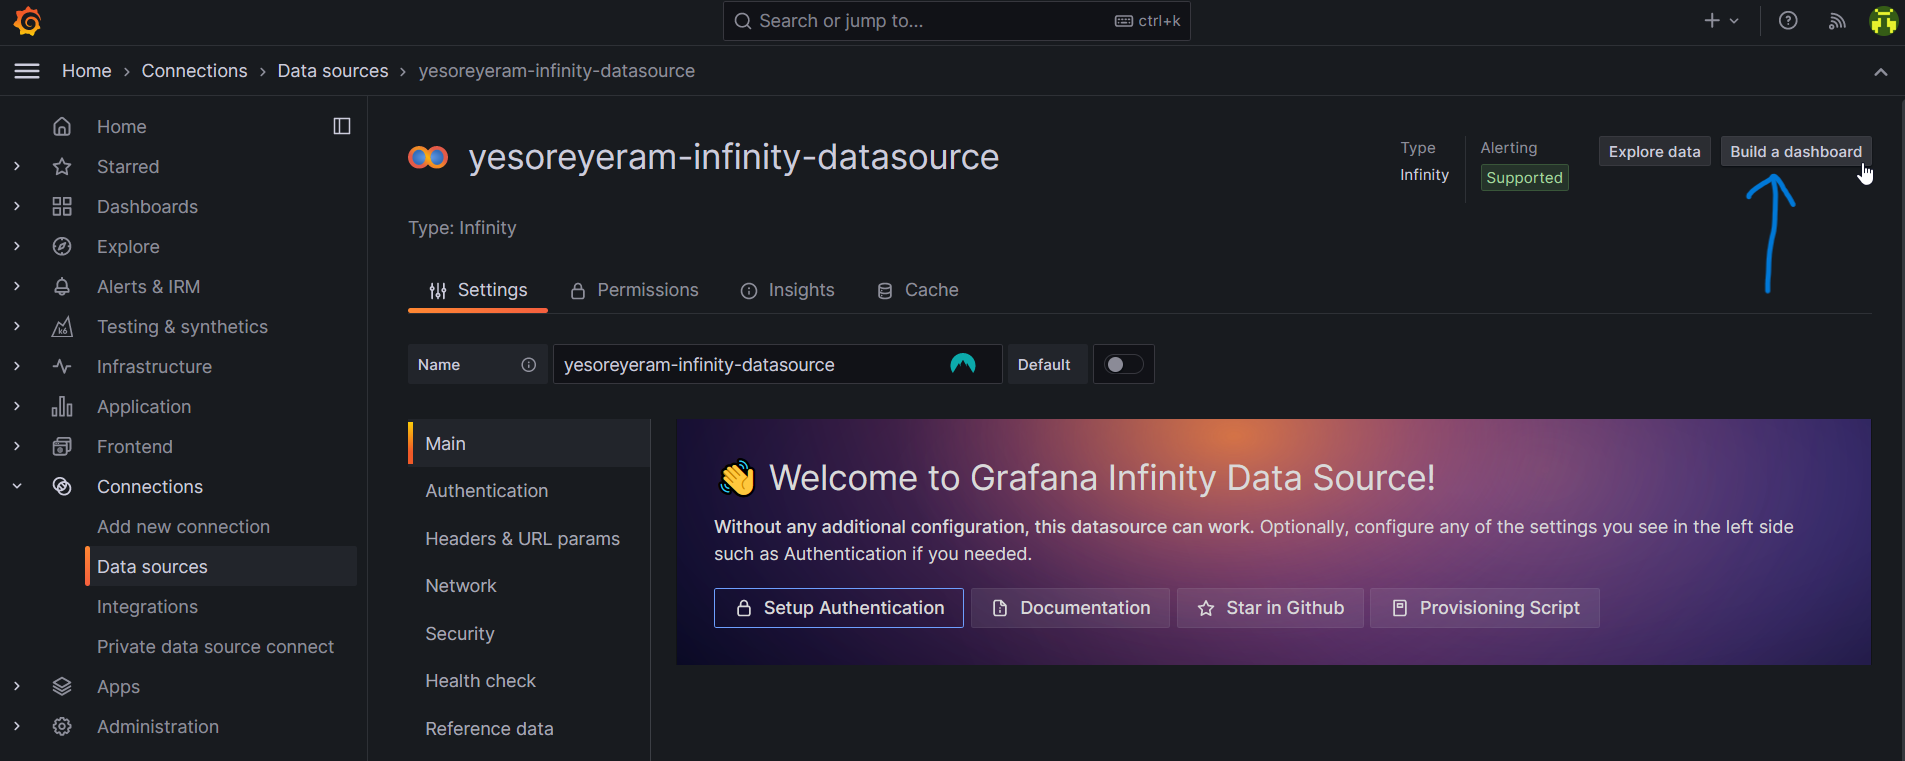
- Now click Build a dashboard
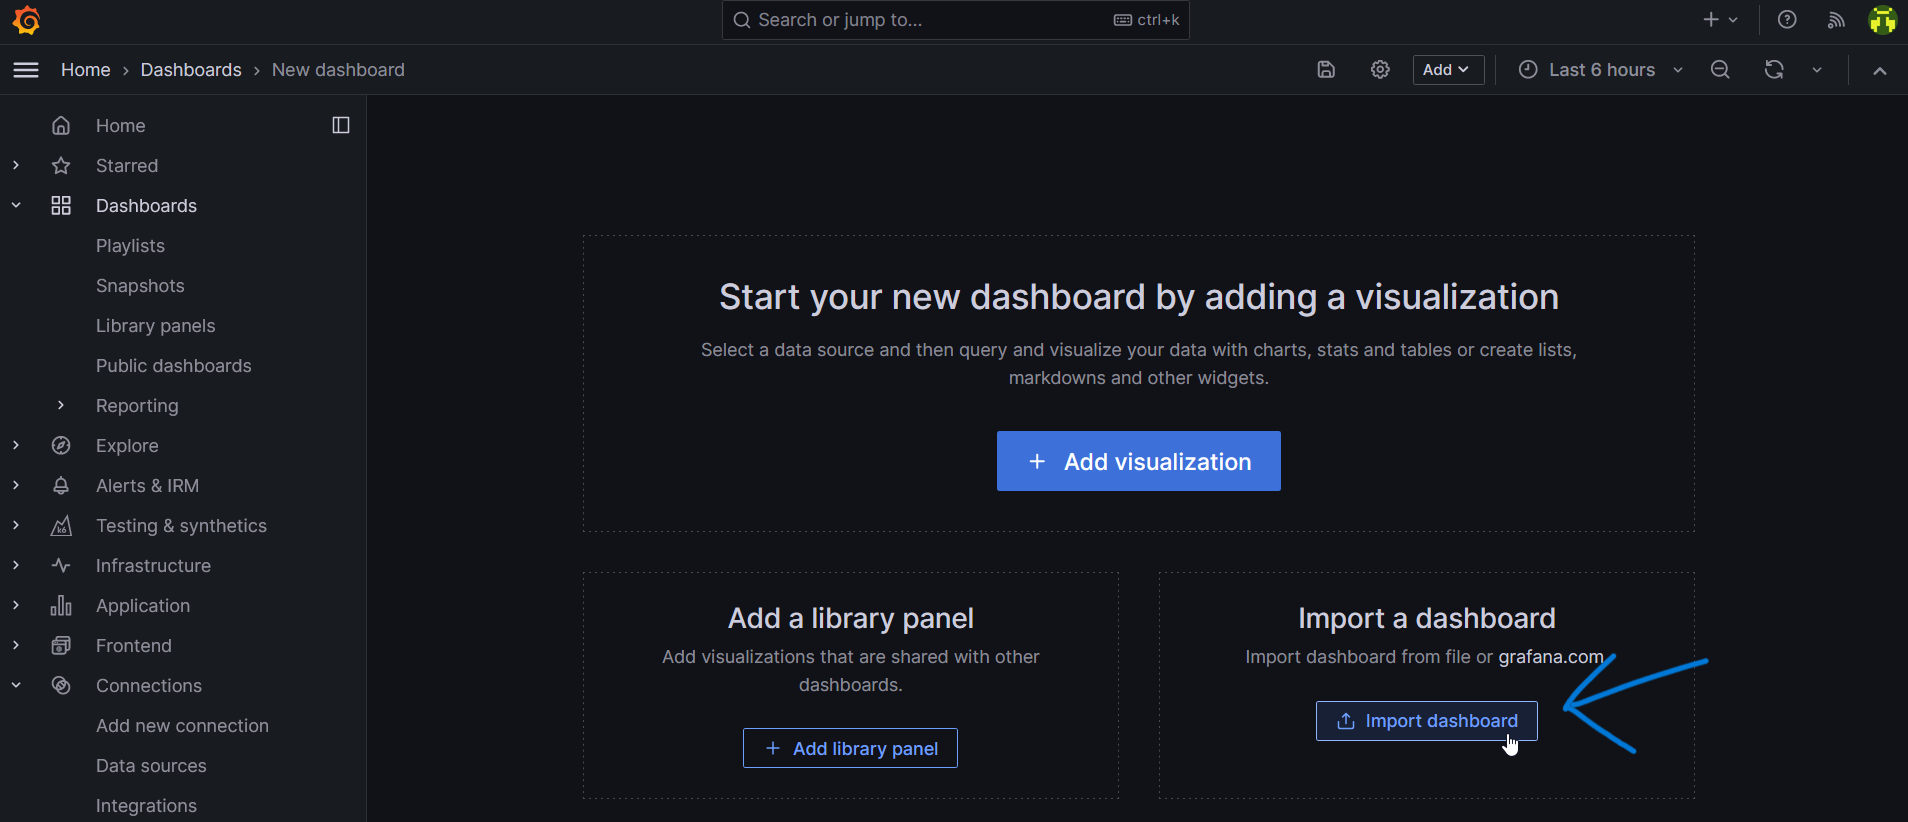
- Click Import dashboard
- Upload JSON found here: https://pixeldrain.com/u/eCSpx8Tp
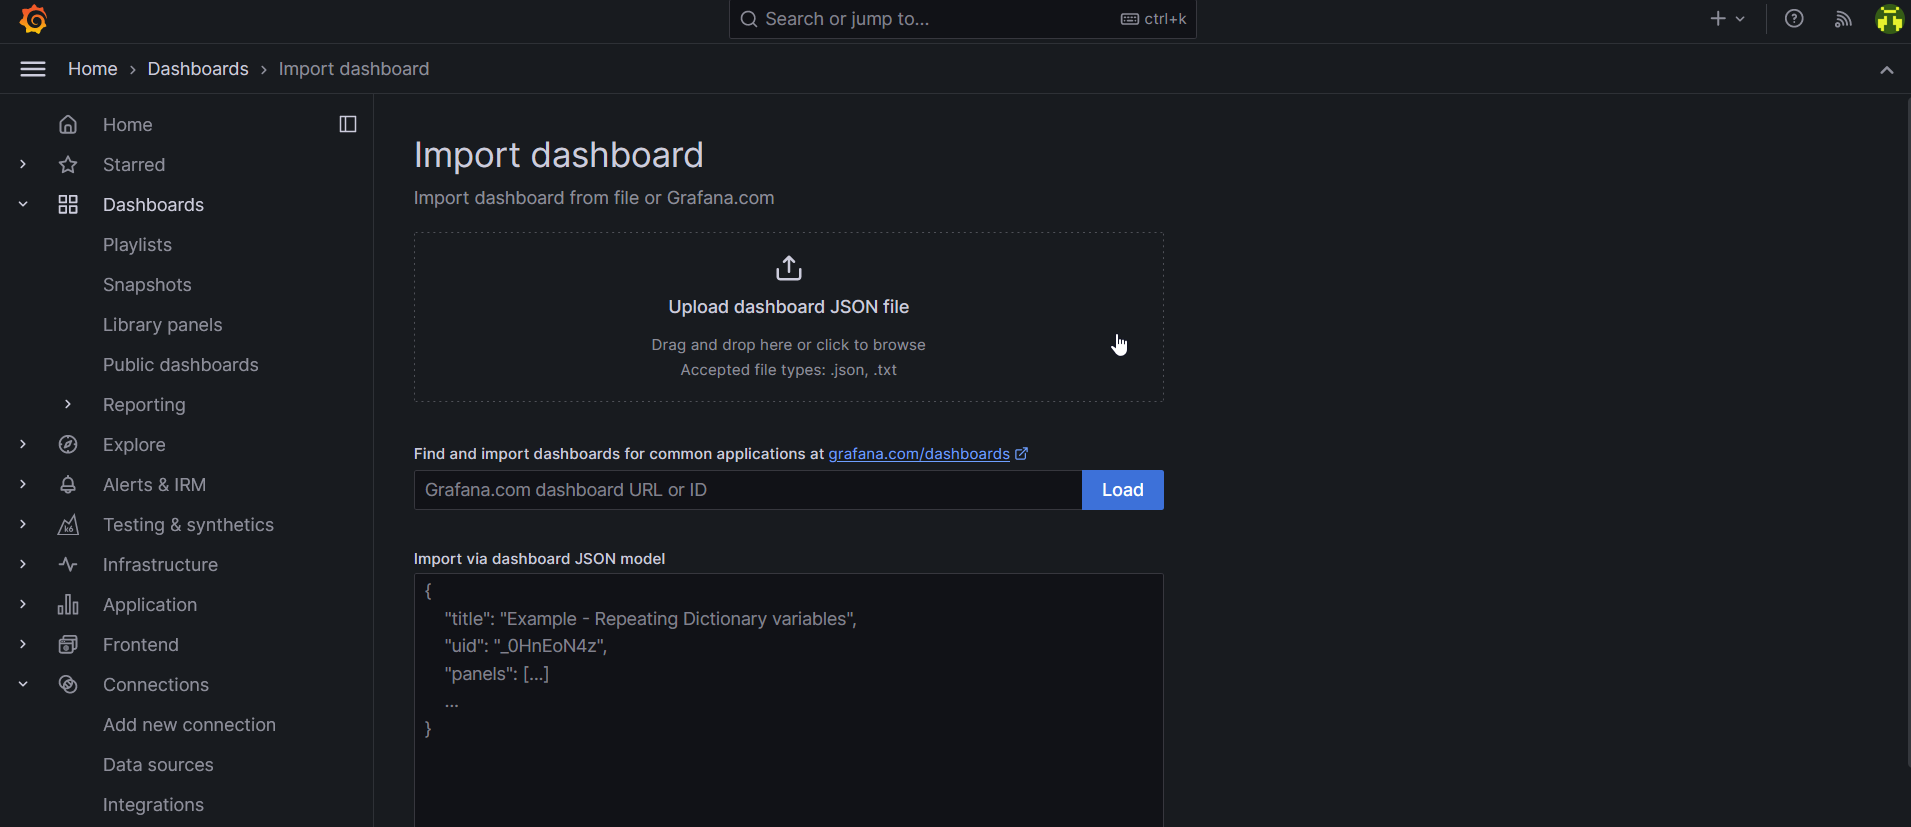
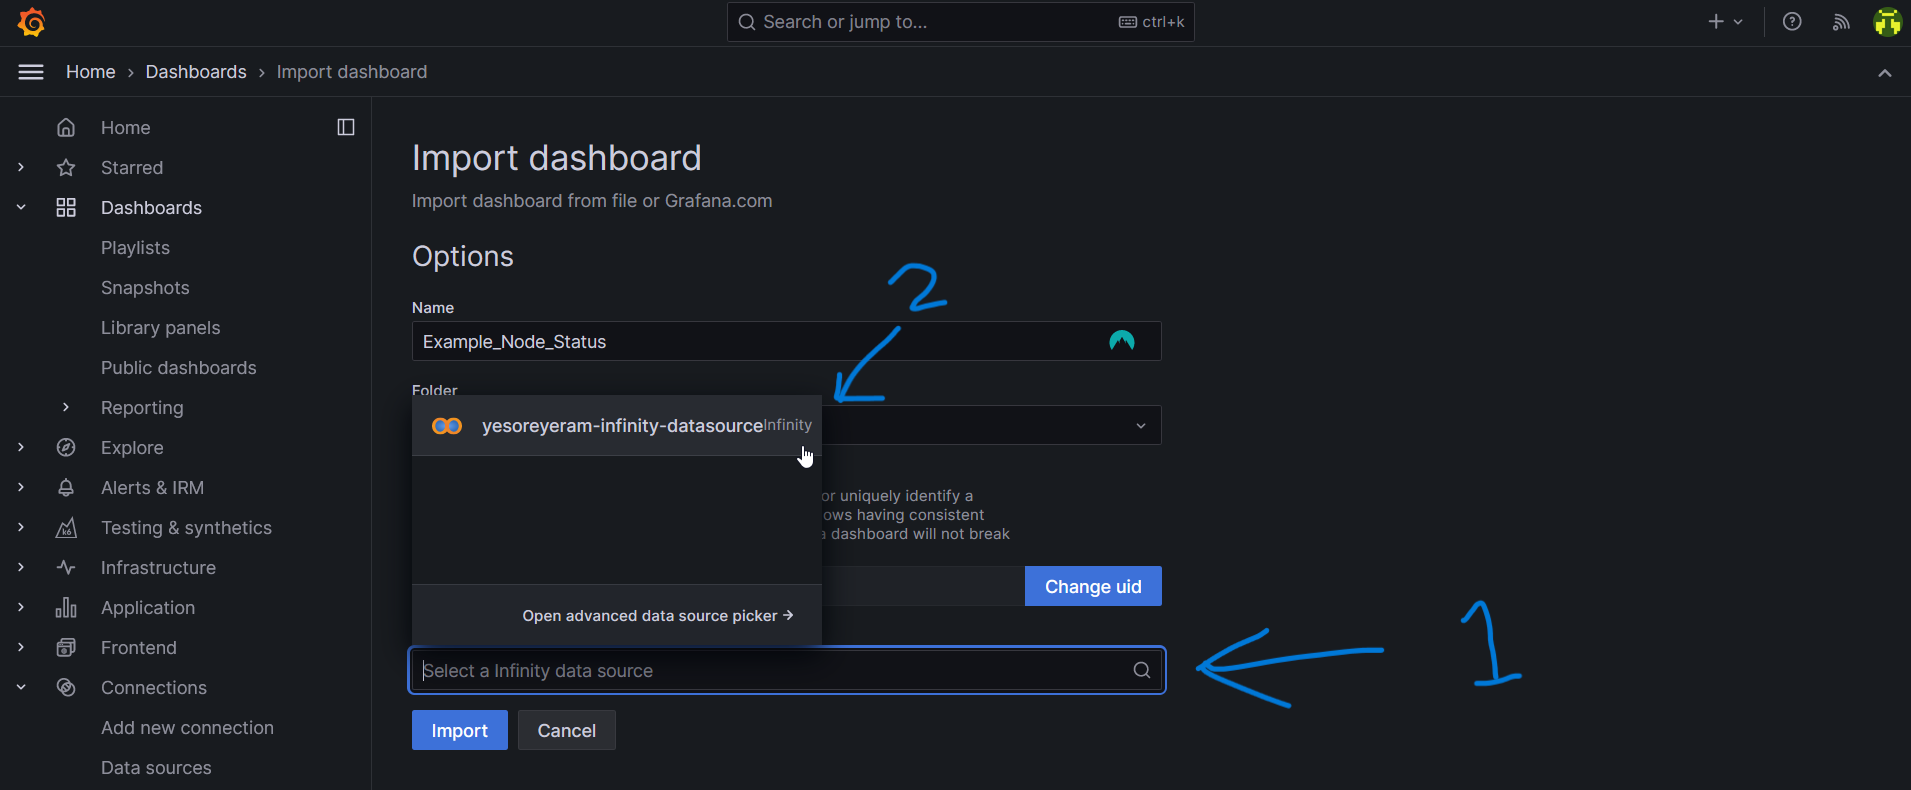
- Click Select a infinity data source, select the data source, click import
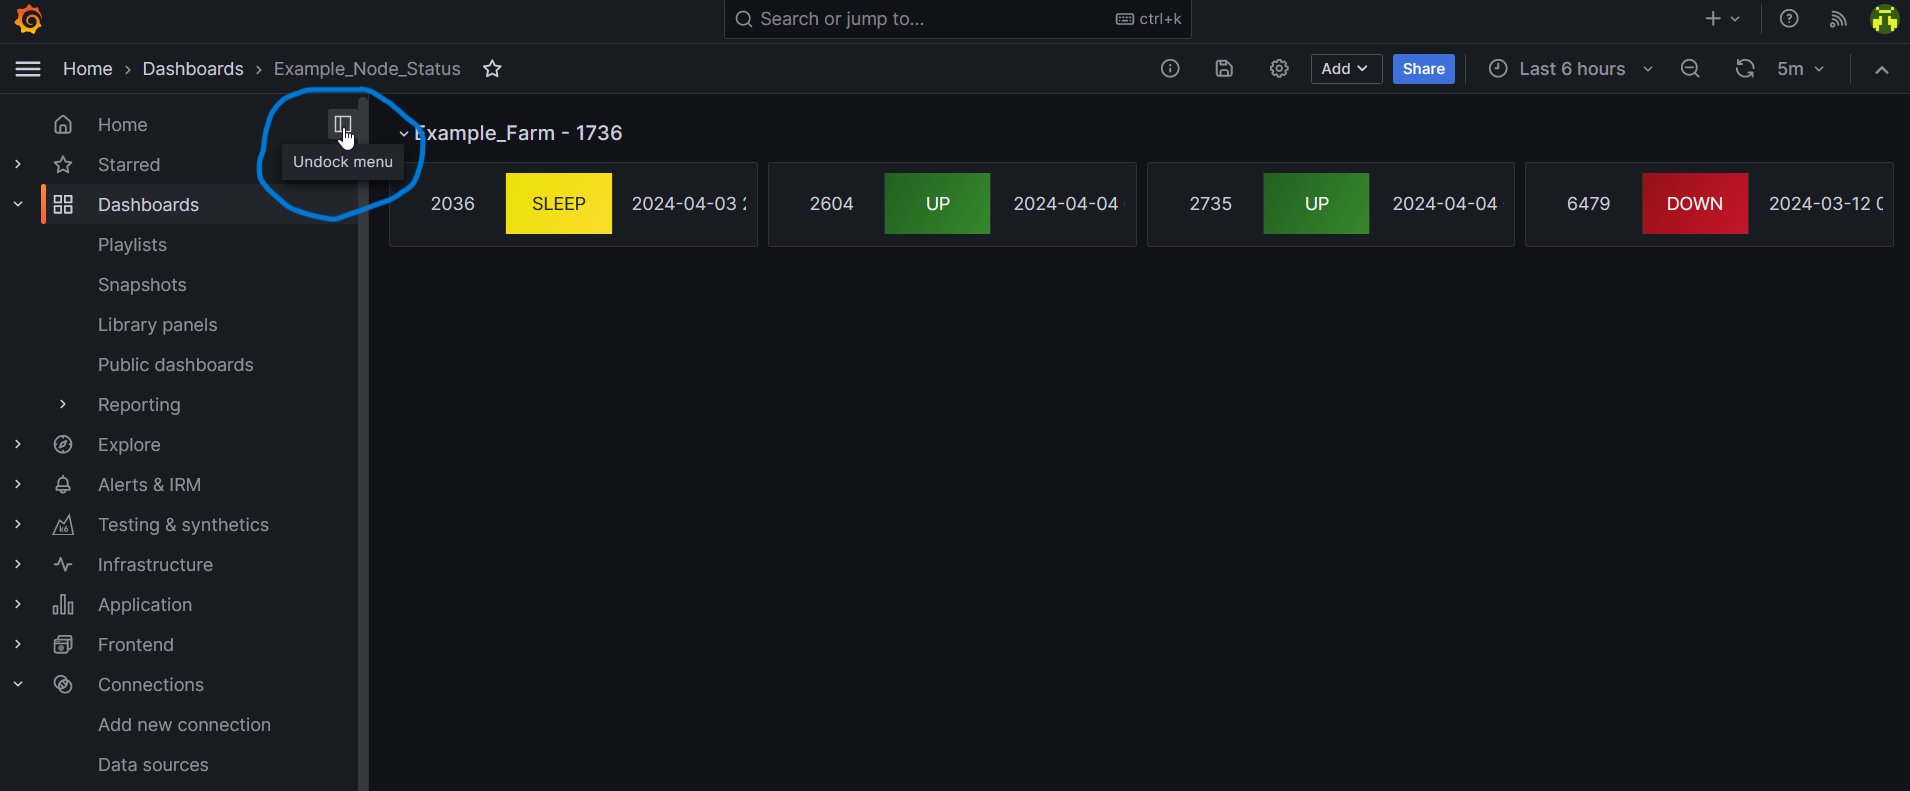
- Dashboard should now be created - you can undock the menu for full width
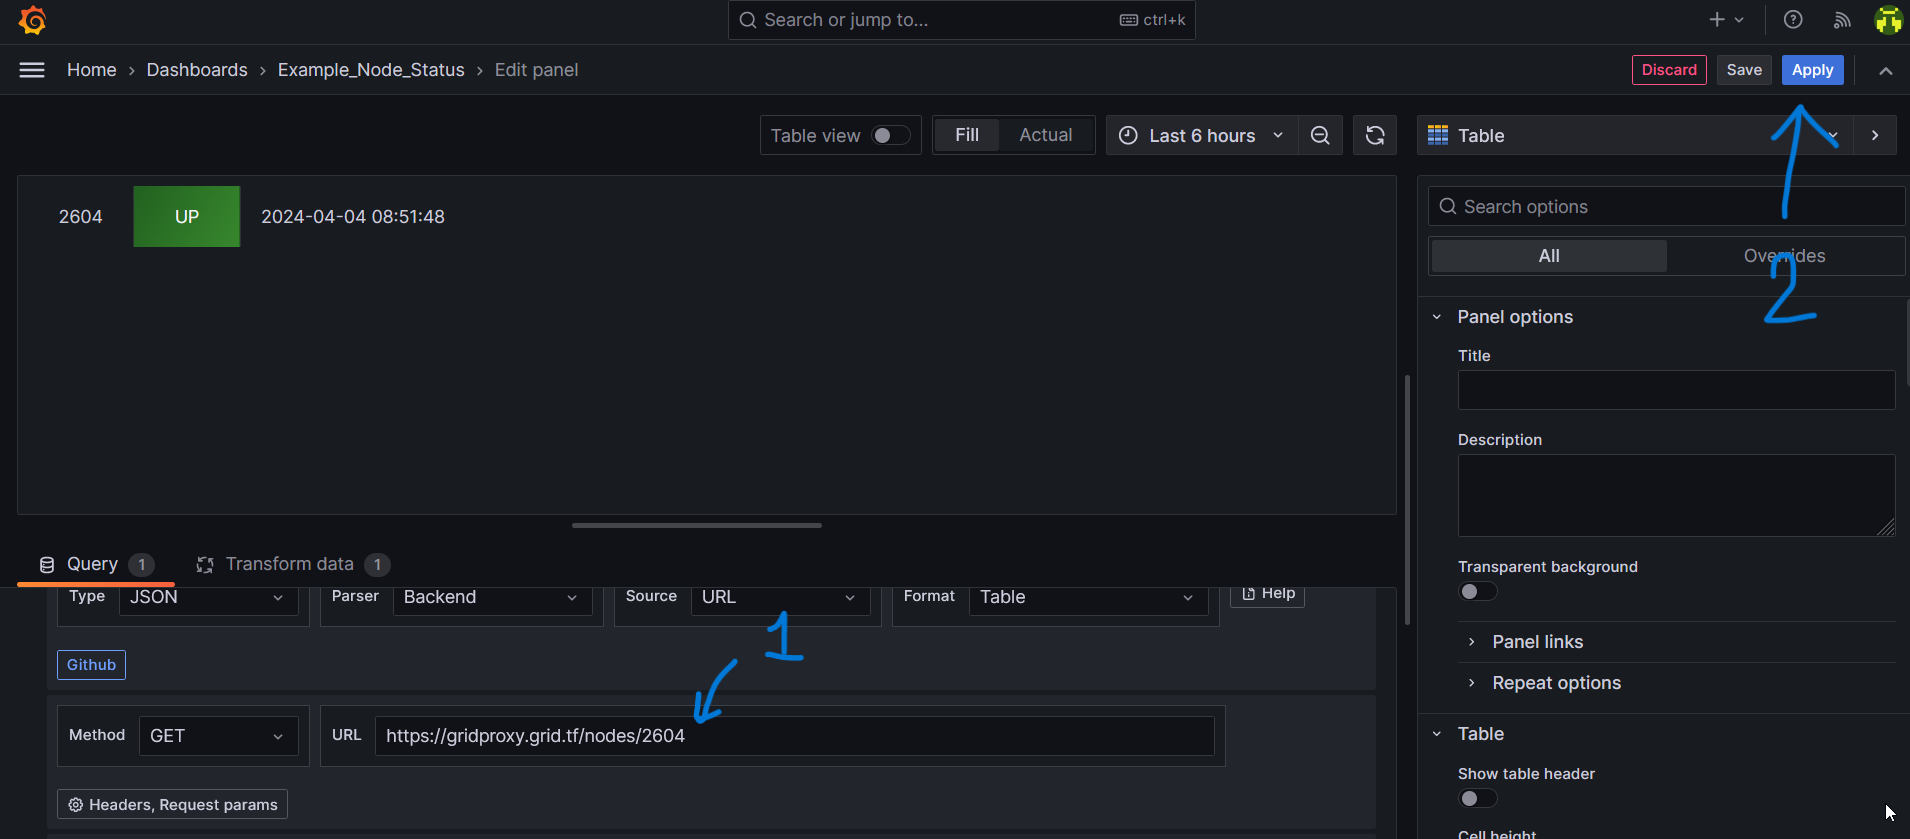
- To edit the panels, hover over and click three dots, then edit

- At the edit page, scroll down the lower part and change the node ID within the URL, click apply
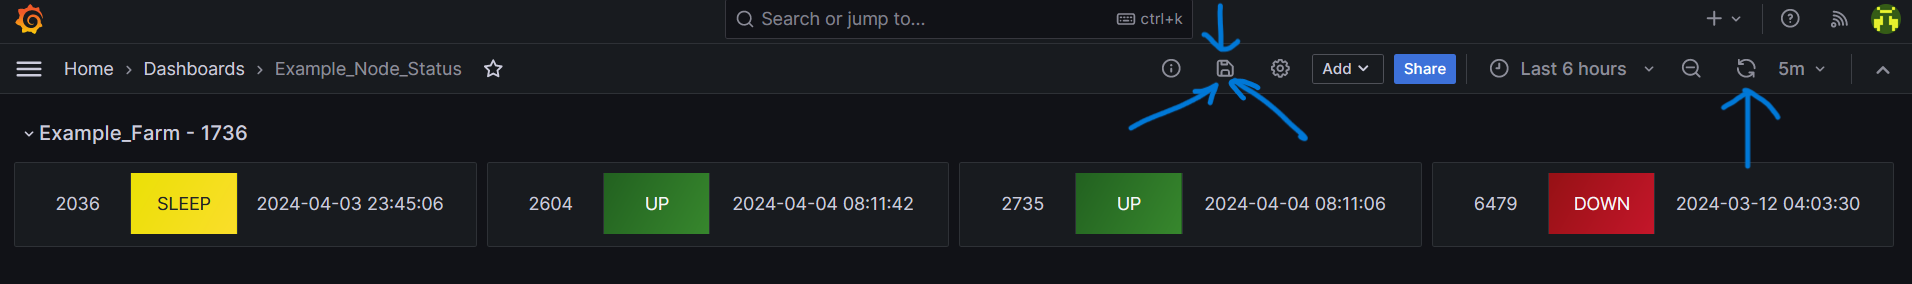
- Back at the dashboard click refresh to see changes, then save - be sure to save after each edit
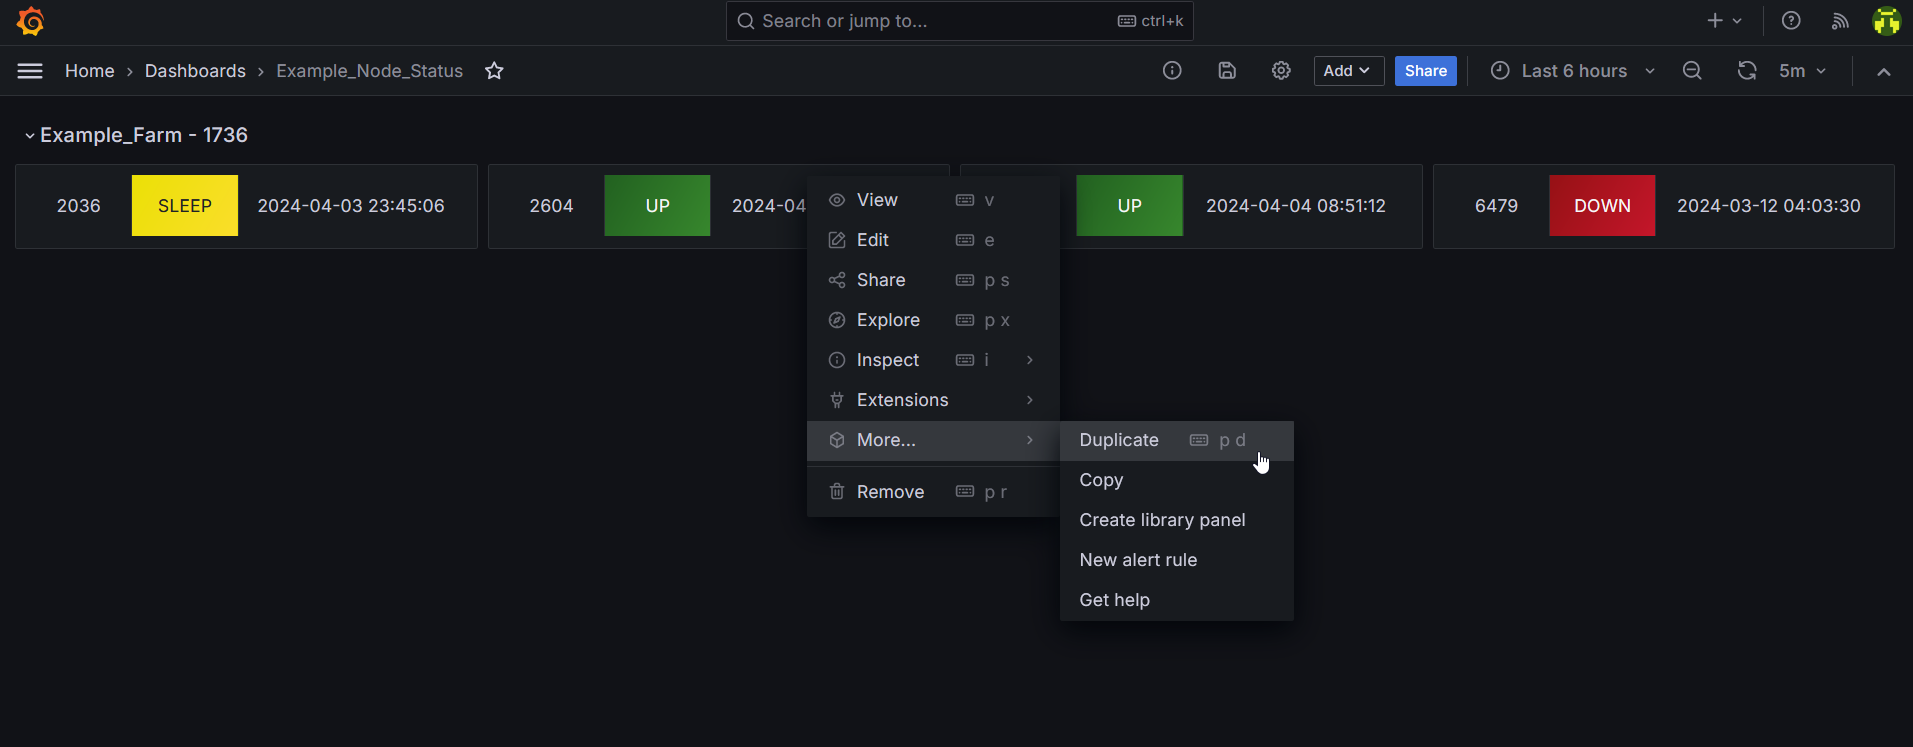
- Panels can be duplicated from the three dot menu > more - this is the easiest way to add more nodes, just go in and edit the duplicate as before
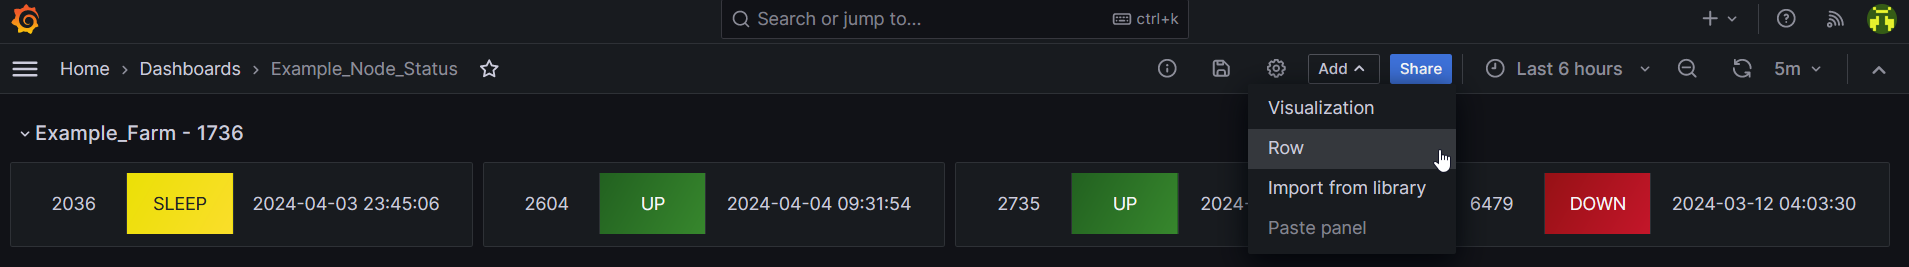
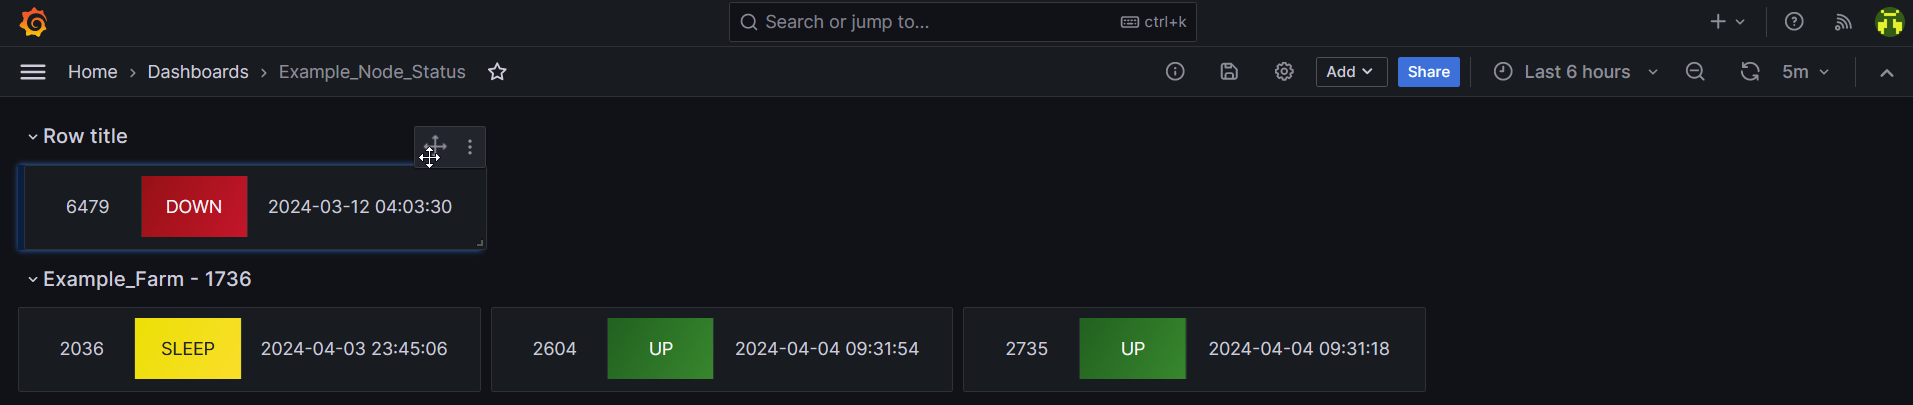
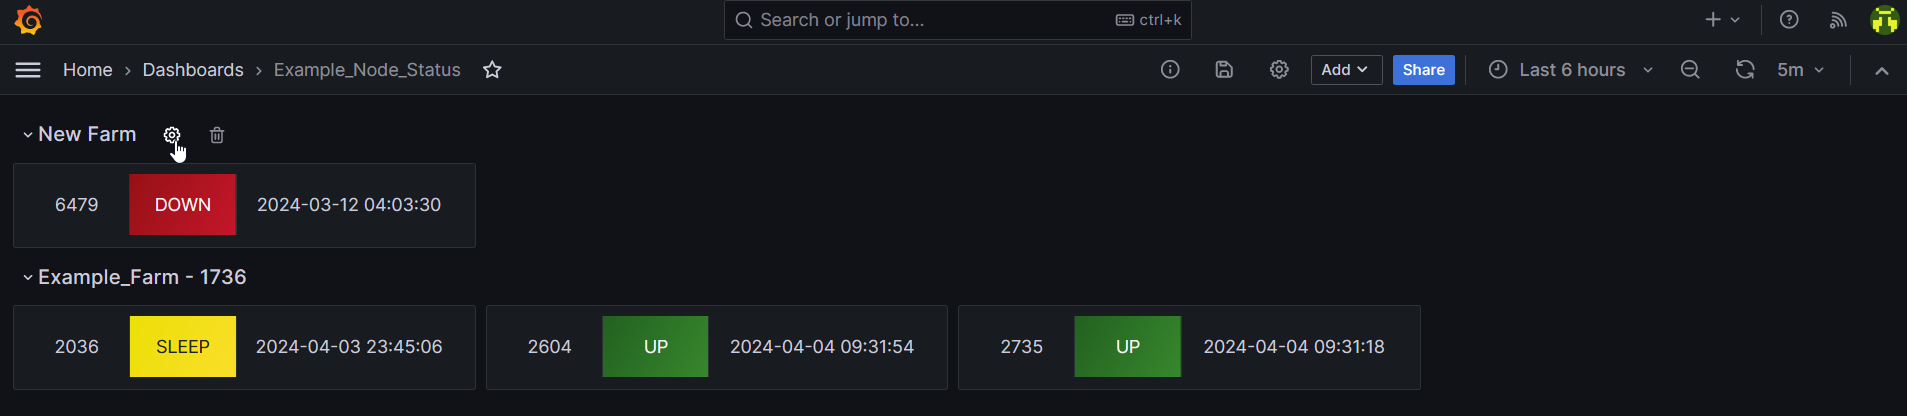
If you have multiple farms you can group nodes under a “Row” - Click Add > Row then drag the panels under the newly created row. Rename the row using the gear icon
Be sure to save your dashboard after these changes! It’s a pain having to go back and redo stuff because you forgot to save - ask me how I know!