
Hi everyone,
I’m happy to (finally) be sharing some initial results from a little project I’ve been working on. This started as a simple question, “I wonder if I can figure out what kind of CPUs are in all the nodes on the grid?” Once I was able to query one manually, I thought, “it shouldn’t be too hard to write a script to automate this process and get the rest.” And then, “once I get the CPU model numbers, I should be able to have another script query some benchmark data about them without too much trouble.” Right?
Well, some weeks later, I finally have a first data set and some nice charts to show for it. The methodology, in a nutshell:
- Pull DMI info from nodes over Yggdrasil/RMB
- Extract CPU models from DMI info and keep a tally, minding multi CPU systems
- Grab the Passmark score info and reported TDP (power consumption) for each model
Since data was queried directly from nodes, it means that the set I have are nodes that were online and responded over RMB. Some systems also just don’t report their CPU model, but they are rare.
Let’s get into the charts. I’d love to do more and more awesome charts, but I’m a little rusty with graphing in spreadsheets. When I return to the scripts, I’ll add some data processing so that less manual work is needed to define the ranges and sums.
Passmark per thread
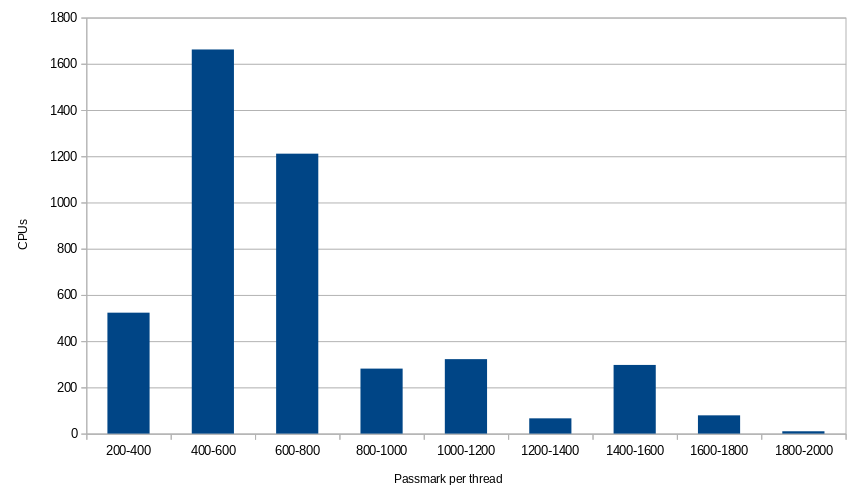
This chart shows what you get when you take the total benchmark score for each CPU and divide it by the number of threads it has. It gives us an idea of how much performance each thread (or by extension CU reservation) can expect when the CPU is busy.
The first three bars of this chart are mostly Intel Xeon server chips that have higher thread counts. Most of the chips that hit 800 or above are the consumer Intel Core and AMD Ryzen lines, with a few higher end server models.
Single thread rating
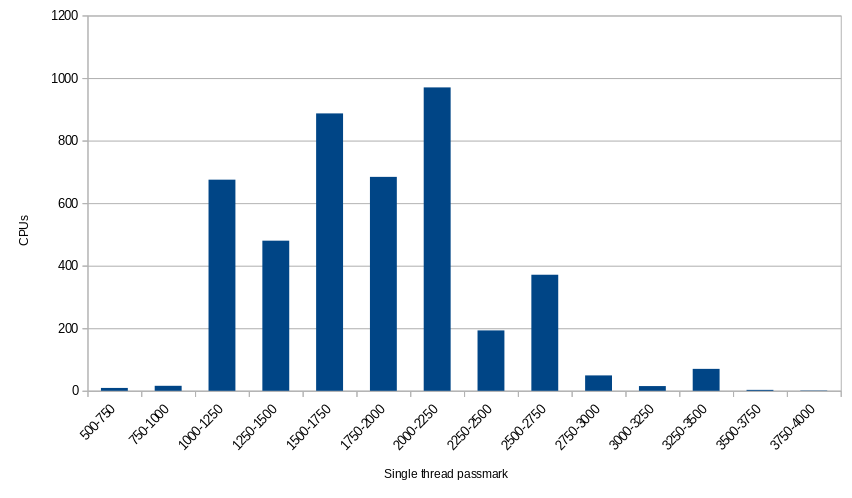
This shows the performance when only a single thread is in use. Comparing to above, we can see how multi core and multi threaded systems have to share resources when the multitask, but can execute a single task with better performance, in general. It’s also the case that certain CPUs are more optimized for having many threads versus single thread performance. Likewise, this is more and less important for different applications.
Efficiency
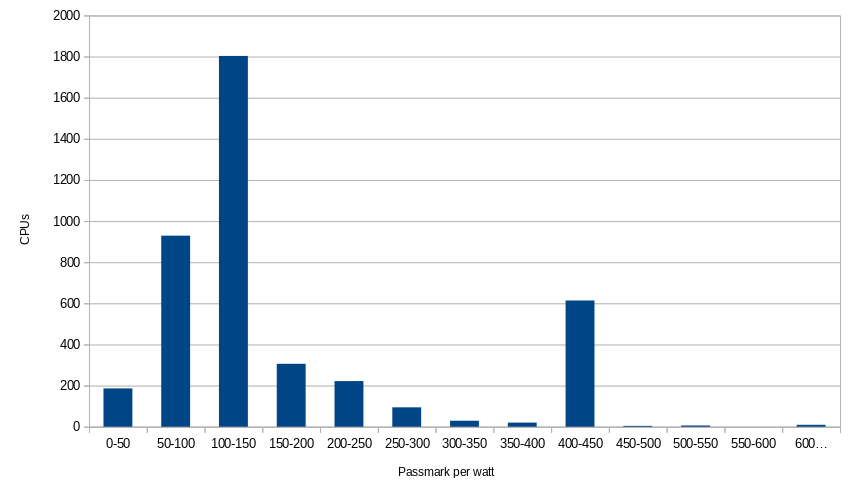
Here, we take the total benchmark score and divide it by the TDP rating (typical power usage in watts). This chart should definitely come with a caveat that TDP is a single figure provided by CPU manufacturers that definitely doesn’t give the full picture on a chip’s power consumption under different kinds of loads.
You’ll notice the spike out to the right, which are our Intel NUC based Titans. I’d be curious to see some comparisons of NUCs versus enterprise grade hardware performing the same job (maybe a cluster of NUCs versus one big server). Of course, there are other reasons to prefer a bigger machine with features like redundant power supplies.
Final thoughts
Benchmarks and TDP ratings are subjective ways of measuring what a CPU can do and how much power it will consume doing so. These figures should be taken with a grain of silicone.
I’ve avoided passing any judgments based on what I see, for now. Indeed, part of my intention in doing this is giving us a basis for thinking about how we want implement policies that encourage farmers to bring faster and more efficient hardware online.
Please let me know if you have any ideas for the project going forward. Also let me know if you are interested in working with the data yourself and I’ll get you a copy.
