
While we’ll be getting bandwidth testing in a new version of Zos coming soon, I wanted to gather and present some data about what kind of bandwidth is available to workloads running on the ThreeFold Grid today. This post contains my initial findings.
History and motivation
One question that comes up from time to time is how much bandwidth farmers are expected to provide for their nodes. So far we haven’t had a bandwidth requirement for minting TFT each month, but there has been some extensive discussion around what would be reasonable.
It became clear from that discussion that it’s difficult to reason about what should be without having a solid sense for what is. By giving a snapshot of the current situation with farming bandwidth, I hope to provide the latter.
Methodology
The figures and charts below were obtained by attempting to create deployments on every active node on the Grid. These deployments obtained bandwidth and public IP data for each node, using a well known internet speed testing service that facilitates connecting with local endpoints that provide the other side of the bandwidth for testing.
Caveats
While I think the data I gathered are useful and interesting, there are a few substantial caveats.
Single data point per node
An important note here is that these results are just a single data point for each node that was successfully tested. A more ideal method would be to gather more data points at different times of day and somehow combine them.
IP versus farm
A “farm” on the Grid is a logical collection of nodes that don’t necessarily have any physical relationship (sharing an internet connection). Therefore, this project doesn’t consider farms at all. Instead, we look for nodes that share a single public IP. These are nodes that most likely share a single internet connection and bandwidth allocation.
Of course, there are some special cases, like CGNAT and sites with multiple public IPs on a single uplink. In the case of CGNAT, I think the chances of two nodes on the Grid sharing a public IP for this reason is currently slim to none.
For multiple public IPs, it would be possible to improve the data a bit by looking for nodes with public IPs assigned (gateway nodes) and attempting to group them with other nodes that all share bandwidth. I didn’t attempt that for this initial report, so there’s some skew in the data—nodes with a public IP will appear to have a dedicated connection when probably they shares bandwidth with other nodes (all working gateways I’m aware of today do).
Results
First, some high level stats:
| Nodes queried successfully | 1579 |
| Public IPs (node groups) | 732 |
| Average download speed | 414 mbps |
| Average upload speed | 204 mbps |
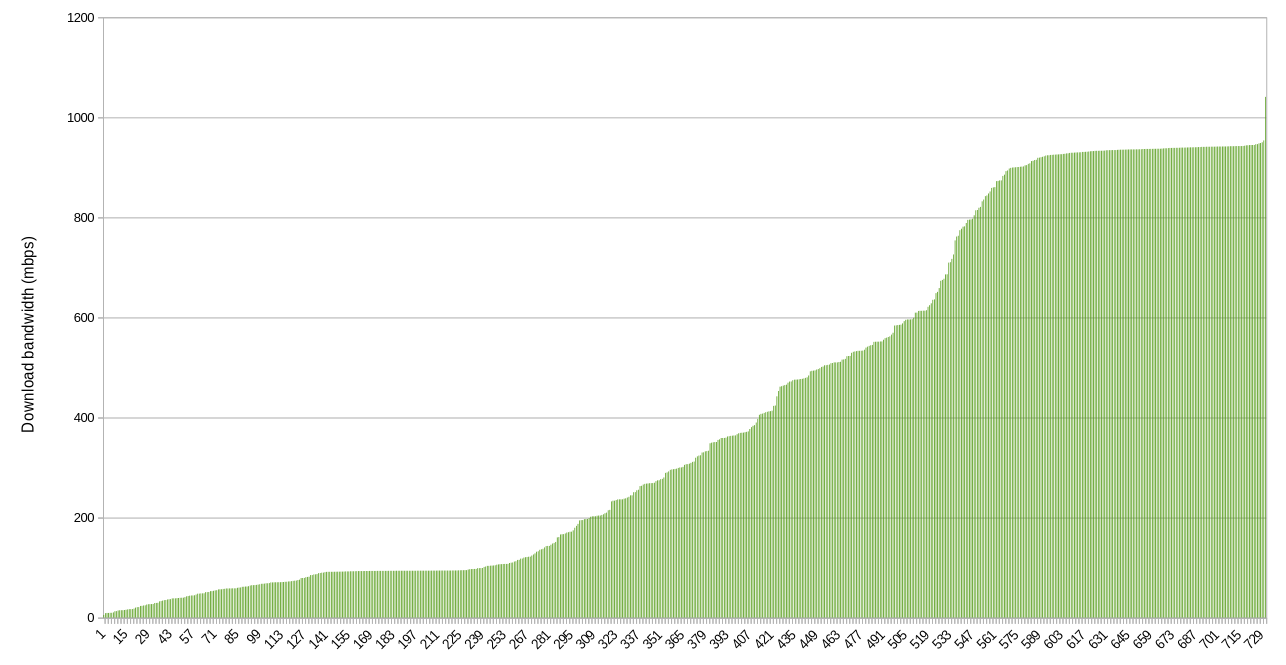
Bandwidth per IP
Here’s a graph showing the download bandwidth recorded for each IP address. In case multiple queries were made for a single IP (multiple nodes), then the highest value is used.
Download
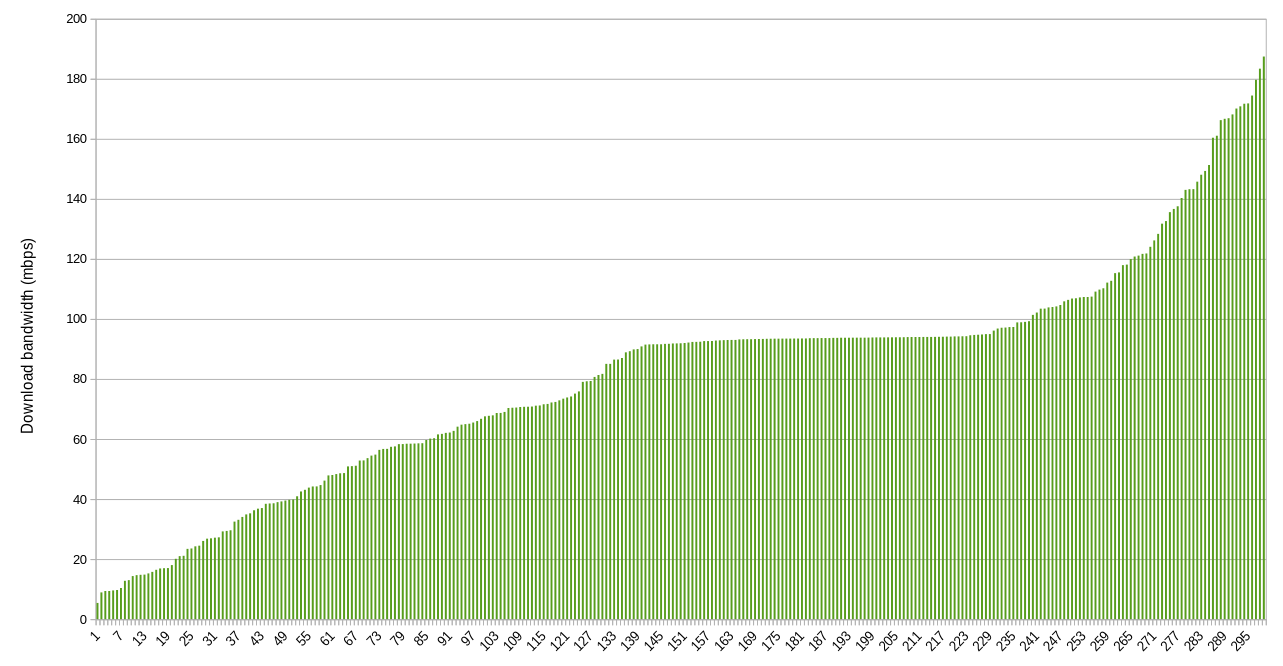
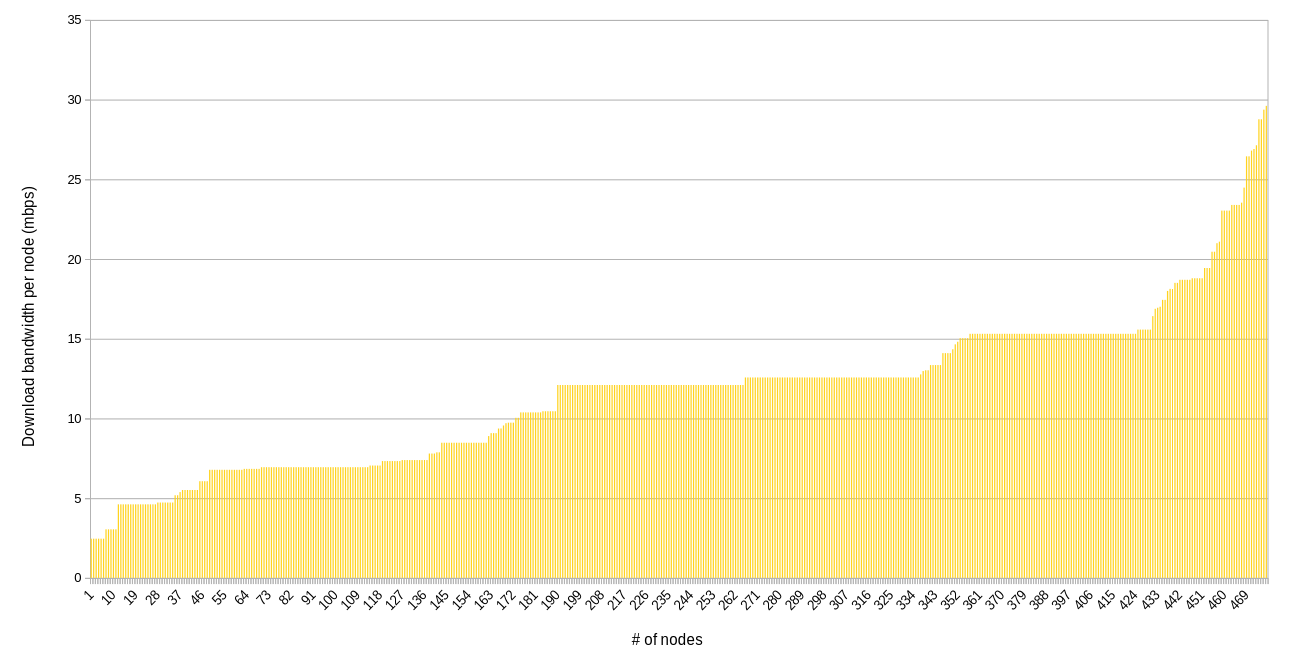
The same chart, zoomed into the low end:
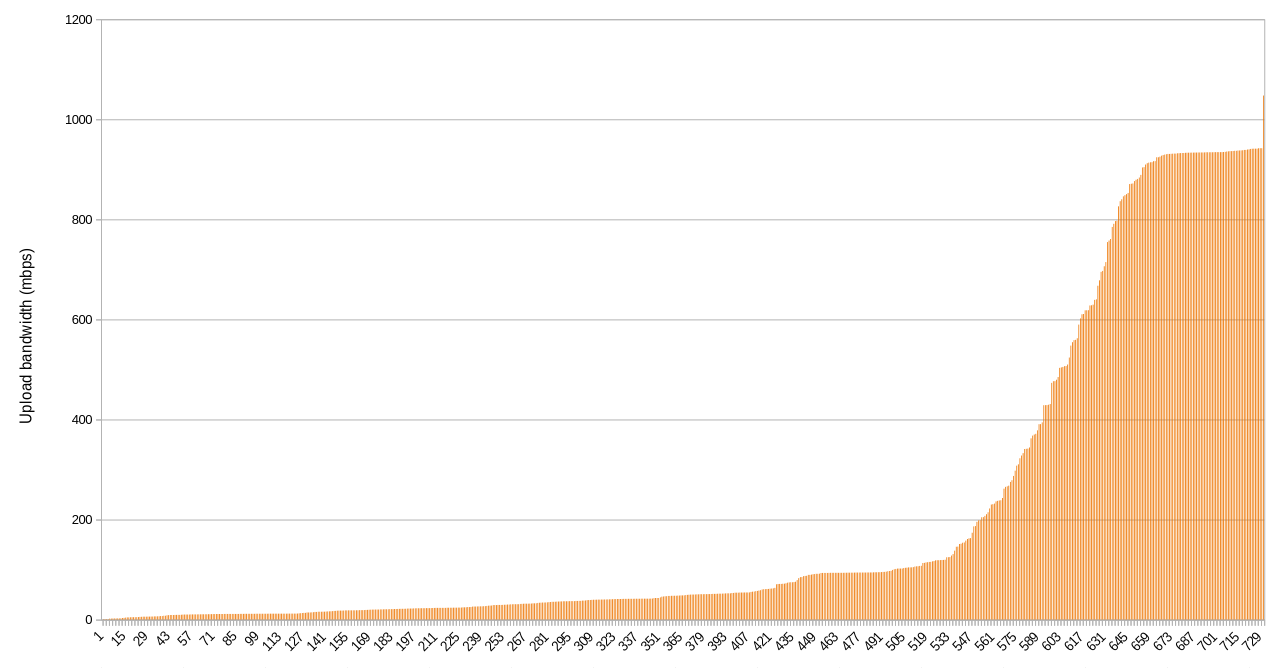
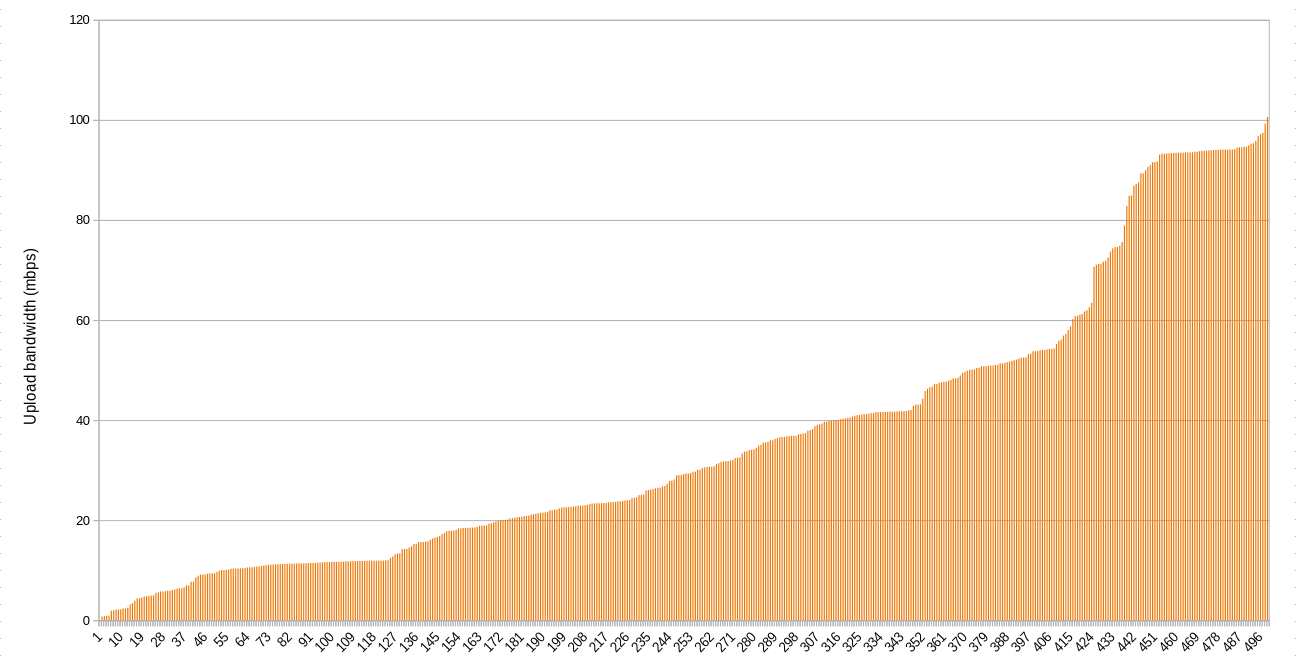
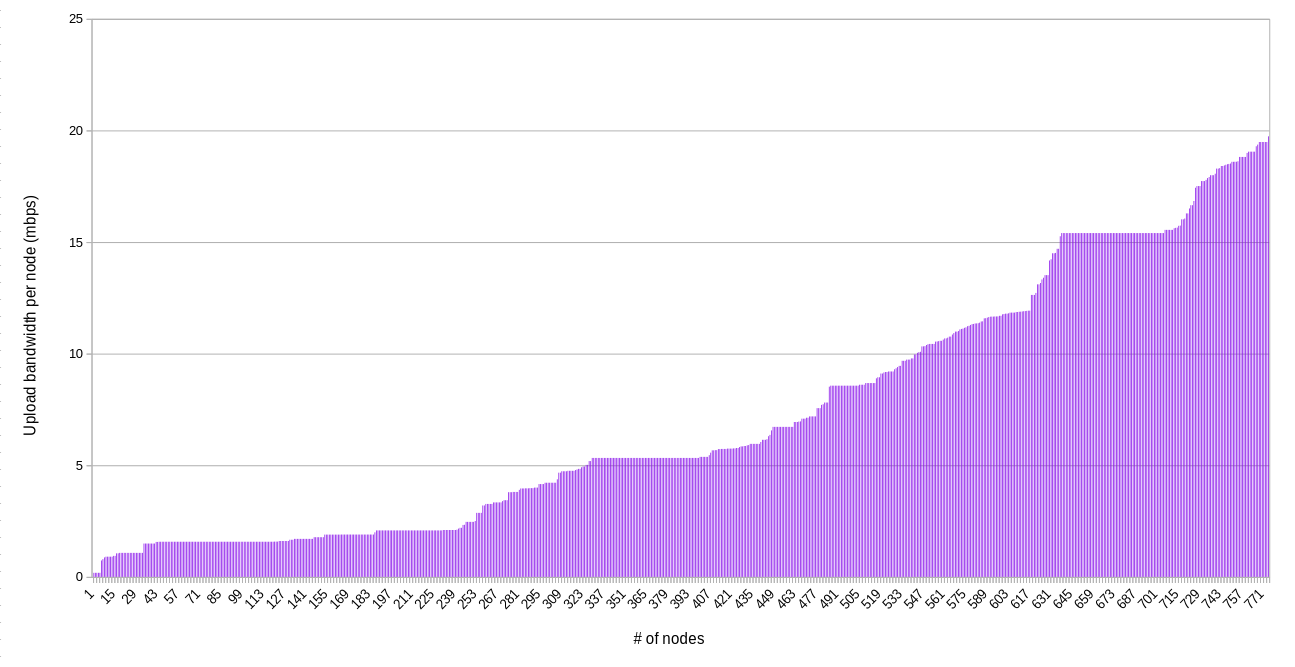
Upload
Bandwidth per node
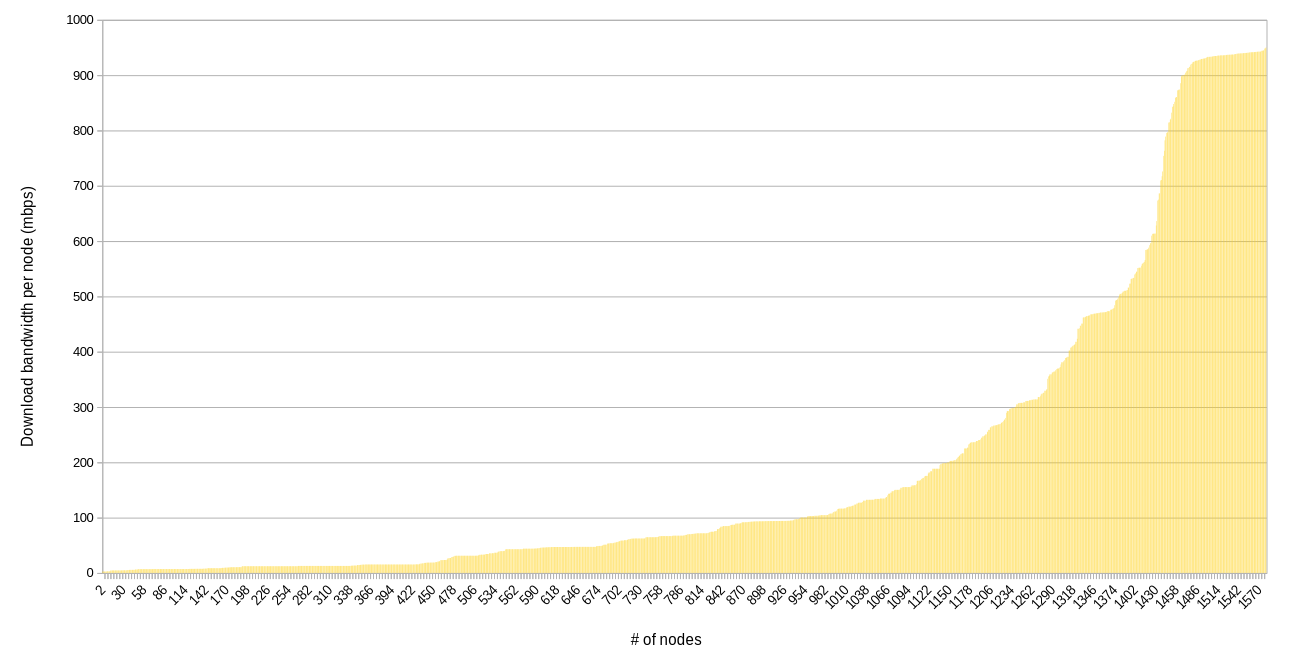
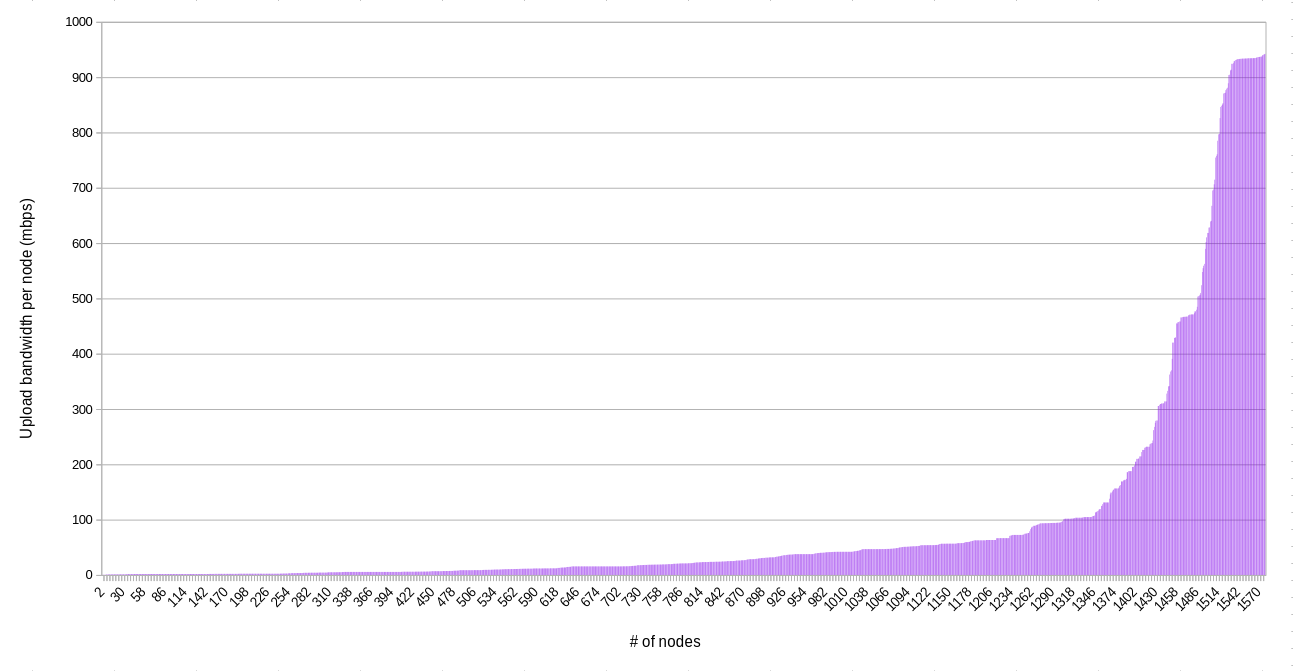
The following charts are similar to above, but they show the bandwidth available per node. That is, the bandwidth on an IP divided by the number of nodes on that IP.
This section comes with its own major caveat, which is that no attempt was made to account for farmerbot managed nodes in these figures. That is to say that many connections are shared among more nodes, but the nodes were asleep and thus not considered. Likewise, there are a number of larger farms that are not using the farmerbot but still have many idle nodes.
Perhaps a future iteration of this report can attempt to better balance the cases of sleeping nodes and idle nodes that are awake.
Download
Upload
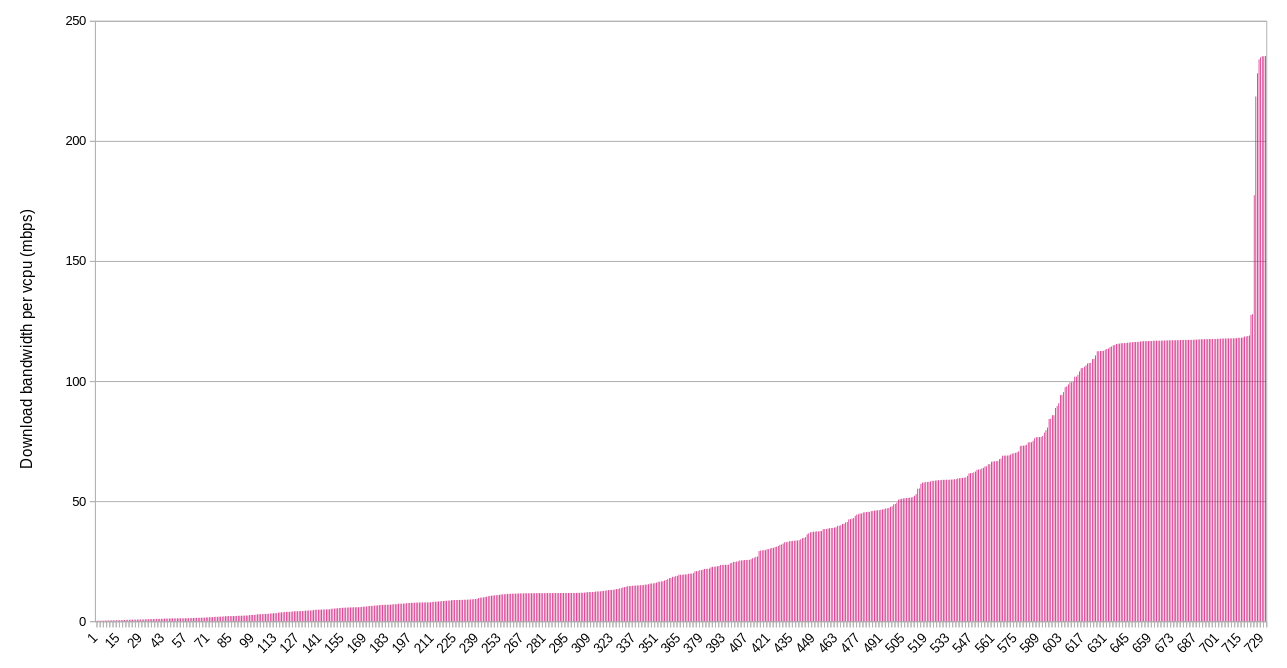
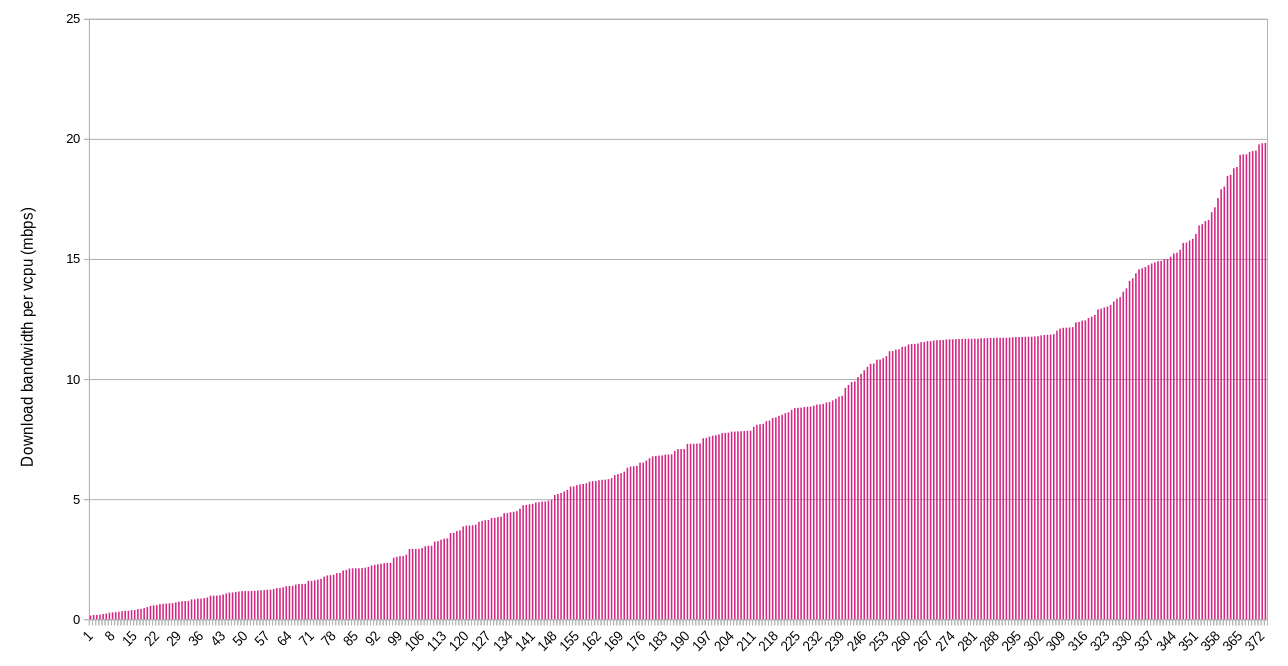
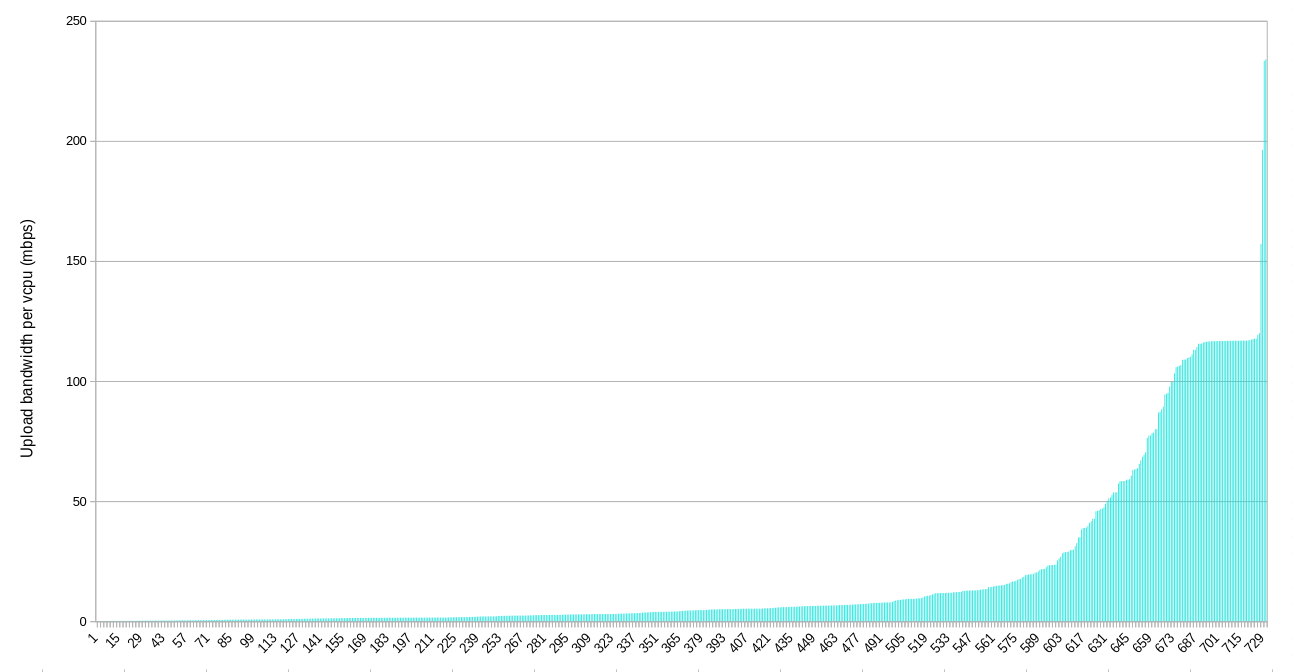
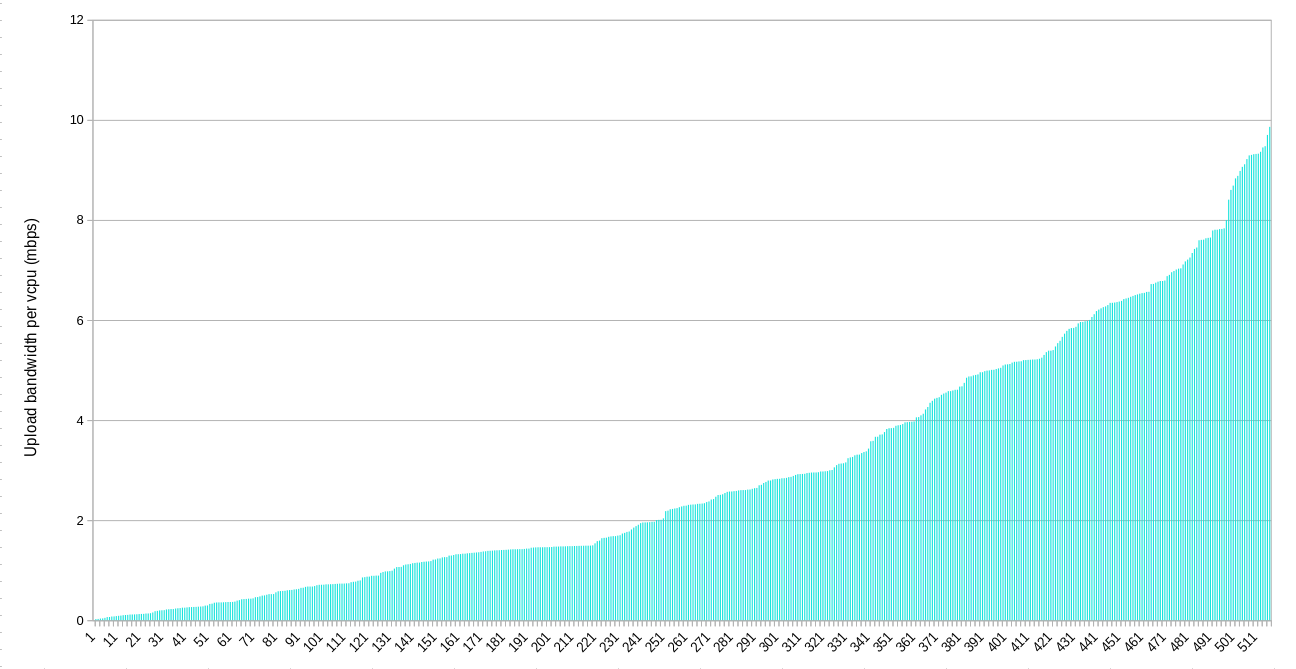
Bandwidth per cpu
Finally, these last charts show the amount of bandwidth per vcpu for each IP queried.
Download
Upload
Discussion
The shapes of the graphs confirm immediately one suspicion we might have about the types of connections that farmers have (generally in a residential setting): they are asymmetric. There’s a lot more download bandwidth available than upload, in general.
On the other hand, there appear to be about 100 sites providing more or less gigabit symmetric connections, which is pretty impressive.
Nearly every farmer is providing at least 10 mbps of download bandwidth, and that’s encouraging. On the other hand, many lower bandwidth farms have multiple nodes, meaning that about 170 nodes have less than 10 mpbs download bandwidth per node available. This could become an issue if utilization ramps up and these farmers can’t or don’t size up their connections.
When it comes to upload, there are about 50 IPs with less than 10 mpbs total, and about 530 nodes that have less than 10 mbps per node available (about 190 nodes are below 2 mbps per node upload bandwidth). This represents a potential bottleneck if workloads on these nodes are attempting to serve data concurrently, especially if the farmer is using their uplink for other purposes at the same time. On the other hand, a high quality video call only requires about 1-2 mbps of symmetric bandwidth, so even 10 mbps of upload bandwidth can do a good amount of work.
While per node figures provide one useful view, nodes can vary quite a bit in their capacity. That’s why I also included the per vcpu stats. These might be the most helpful for establishing baseline bandwidth expectations for farmers. If the average user is renting 2 vcpus and there’s 5 mbps available per vcpu, then the worst case of simultaneous usage (not counting the farmers other activity) is 10 mpbs per user. Of course, most usage is not simultaneous and the best case is that a user gets the full bandwidth available at the IP.
When looking at the per vcpu figures, the potential upload bottleneck is visible again. About half of the IPs serving the Grid don’t have 5 mbps of upload bandwidth per vcpu. About 1/3 don’t have 2 mpbs per vcpu.
Conclusion
The Grid appears to be healthy overall when it comes to bandwidth. On average, farms are small and connections are fast. Every connection measured is rather decent (no dial-up detected!), no matter where in the world the nodes are.
With that said, the potential concern when it comes to bandwidth is not about the average node or even single nodes in general. Rather, the potential issues are where multiple nodes are sharing a slower connection or where large numbers of nodes are sharing even a reasonably fast connection.
The direction I’d go next with this investigation would be looking at the larger collections of nodes sharing internet connections, including farms using the farmerbot. Of course, we cannot use these methods to measure the potential for farmers to size up their connections as demand for utilizing their nodes grows. Since we know some farmers are planning to take this approach, the Grid’s ability to meet the bandwidth demands of workloads is indeed greater than what the numbers can show.